正在加载图片...
5.The Sampling Process 5.The Sampling Process 5.The Sampling Process Consider the continuous-time signal 22 where 4= An Example 2 x.)=Ac0s(2πf1+p)=Ac0s2,1+) is the normalized digital angular frequency of Consider the three continuous-time signals The corresponding discrete-time signal is x(n) g1(0)=c0s(6T0,g2(0=c0s(14T),8(0=c0s(26T0 x(n)=Acos(SonT+)=Acos on If the unit of sampling period Tis in seconds, of frequencies 3 Hz,7 Hz,and 13 Hz,are sampled at the unit of normalized digital angular a sampling rate of 10 Hz,i.e.with T=0.1 sec. frequency o,is radians/sample while the unit generating the three sequences 2 n+ 4cos(,+p of normalized analog angular frequency is g1(n)=cos(0.6 )g(n)=cos(14 n).g;(n)=cos(2.6n) radians/second 43 44 45 5.The Sampling Process 5.The Sampling Process 5.The Sampling Process Plots of these sequences and their parent time functions are shown below: This fact can also be verified by observing that The above phenomenon of a continuous-time signal of higher frequency acquiring the identity of a sinusoidal sequence of lower frequency after g2(n)=cos(1.4mn)=cos((2-0.6r)n)=cos(0.6mn) sampling is called aliasing 8(m)=cos(2.6n)=c0s(2x+0.6x)m))=c0s(0.6xm) Therefore,additional conditions need to imposed so that the sequence xn)can uniquely represent the As a result,all three sequences are identical and it is parent continuous-time signal x (r) difficult to associate a unique continuous-time function with each of these sequences Note that each sequence has exactly the same sample value for any given n 4643 5. The Sampling Process Consider the continuous-time signal The corresponding discrete-time signal is 0 0 ( ) cos(2 ) cos( ) a x t A ft A t
0 0 0 0 1 ( ) cos( ) cos 2 cos cos( ) T T x n A nT A n F A n An
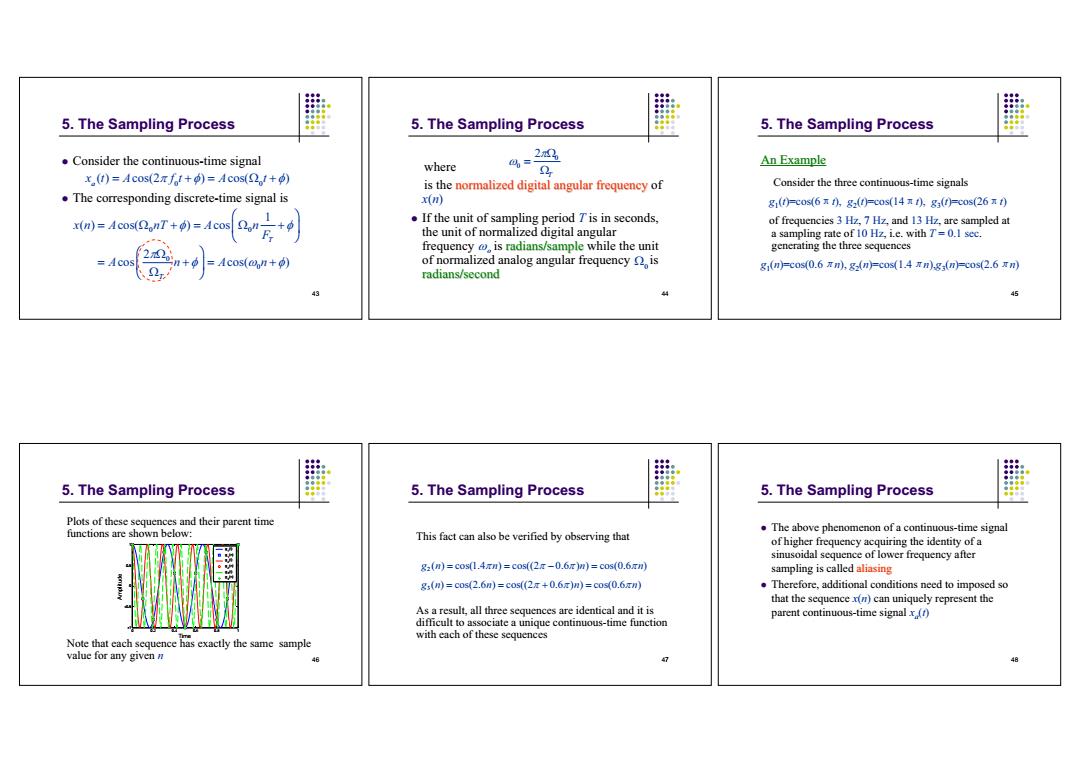
44 5. The Sampling Process where is the normalized digital angular frequency of x(n) If the unit of sampling period T is in seconds, the unit of normalized digital angular frequency is radians/sample radians/sample while the unit of normalized analog angular frequency is radians/second 0 0 2 T o 0 45 5. The Sampling Process An Example An Example Consider the three continuous-time signals g1(t)=cos(6±t), g2(t)=cos(14±t), g3(t)=cos(26±t) of frequencies 3 Hz, 7 Hz, and 13 Hz, are sampled at a sampling rate of 10 Hz, i.e. with T = 0.1 sec. generating the three sequences g1(n)=cos(0.6±n), g2(n)=cos(1.4±n),g3(n)=cos(2.6±n) 46 0 0.2 0.4 0.6 0.8 1 -1 -0.5 0 0.5 1 Time Amplitude g1(t) g1(n) g2(t) g2(n) g3(t) g3(n) Plots of these sequences and their parent time functions are shown below: Note that each sequence has exactly the same sample value for any given n 5. The Sampling Process 47 This fact can also be verified by observing that As a result, all three sequences are identical and it is difficult to associate a unique continuous-time function with each of these sequences 5. The Sampling Process 2 gn n n n ( ) cos(1.4 ) cos((2 0.6 ) ) cos(0.6 ) 3 gn n n n ( ) cos(2.6 ) cos((2 0.6 ) ) cos(0.6 )
48 5. The Sampling Process The above phenomenon of a continuous-time signal of higher frequency acquiring the identity of a sinusoidal sequence of lower frequency after sampling is called aliasing Therefore, additional conditions need to imposed so that the sequence x(n) can uniquely represent the parent continuous-time signal xa(t)�������������������