正在加载图片...
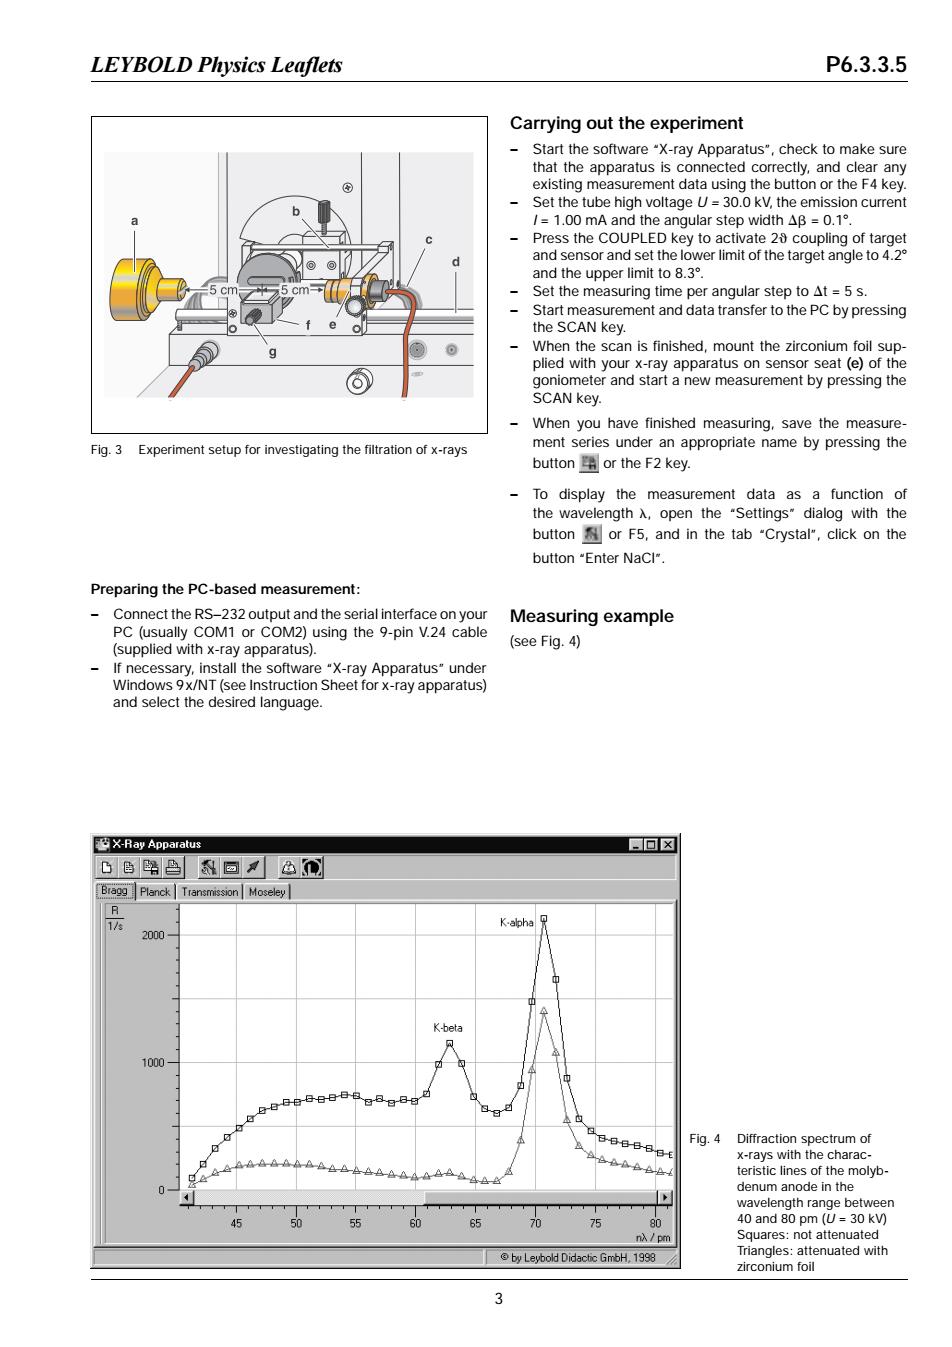
LEYBOLD Physics Leaflets P6.3.3.5 Carrying out the experiment Start the software "X-ray Apparatus",check to make sure that the apparatus is connected correctly,and clear any existing measurement data using the button or the F4 key. Set the tube high voltage U=30.0 kV,the emission current /=1.O0 mA and the angular step width Aβ=0.1°. Press the COUPLED key to activate 20 coupling of target d and sensor and set the lower limit of the target angle to 4.2 and the upper limit to 8.3. Set the measuring time per angular step to At=5 s. Start measurement and data transfer to the PC by pressing the SCAN key. When the scan is finished,mount the zirconium foil sup- plied with your x-ray apparatus on sensor seat (e)of the ⑤ goniometer and start a new measurement by pressing the SCAN key. When you have finished measuring,save the measure- Fig.3 Experiment setup for investigating the filtration of x-rays ment series under an appropriate name by pressing the button or the F2 key. To display the measurement data as a function of the wavelength A,open the "Settings"dialog with the button or F5,and in the tab "Crystal",click on the button"Enter NaCl". Preparing the PC-based measurement: Connect the RS-232 output and the serial interface on your Measuring example PC(usually COM1 or COM2)using the 9-pin V.24 cable (supplied with x-ray apparatus). (see Fig.4) If necessary,install the software "X-ray Apparatus"under Windows 9x/NT(see Instruction Sheet for x-ray apparatus) and select the desired language. X-Ray Apparatus 回☒ 凸色路凸回色 Bragg Planck Transmission Moseley R 1/s K-alpha 2000 K-beta 1000 Fig.4 Diffraction spectrum of x-rays with the charac- teristic lines of the molyb denum anode in the wavelength range between 80 40 and 80 pm(U=30 kV) n pm Squares:not attenuated by Leybold Didactic GmbH,1998 Triangles:attenuated with zirconium foil 3Preparing the PC-based measurement: – Connect the RS−232 output and the serial interface on your PC (usually COM1 or COM2) using the 9-pin V.24 cable (supplied with x-ray apparatus). – If necessary, install the software “X-ray Apparatus” under Windows 9x/NT (see Instruction Sheet for x-ray apparatus) and select the desired language. Carrying out the experiment – Start the software “X-ray Apparatus”, check to make sure that the apparatus is connected correctly, and clear any existing measurement data using the button or the F4 key. – Set the tube high voltage U = 30.0 kV, the emission current I = 1.00 mA and the angular step width Db = 0.18. – Press the COUPLED key to activate 2q coupling of target and sensor and set the lower limit of the target angle to 4.28 and the upper limit to 8.38. – Set the measuring time per angular step to Dt = 5 s. – Start measurement and data transfer to the PC by pressing the SCAN key. – When the scan is finished, mount the zirconium foil supplied with your x-ray apparatus on sensor seat (e) of the goniometer and start a new measurement by pressing the SCAN key. – When you have finished measuring, save the measurement series under an appropriate name by pressing the button or the F2 key. – To display the measurement data as a function of the wavelength l, open the “Settings” dialog with the button or F5, and in the tab “Crystal”, click on the button “Enter NaCl”. Measuring example (see Fig. 4) Fig. 3 Experiment setup for investigating the filtration of x-rays Fig. 4 Diffraction spectrum of x-rays with the characteristic lines of the molybdenum anode in the wavelength range between 40 and 80 pm (U = 30 kV) Squares: not attenuated Triangles: attenuated with zirconium foil LEYBOLD Physics Leaflets P6.3.3.5 3