正在加载图片...

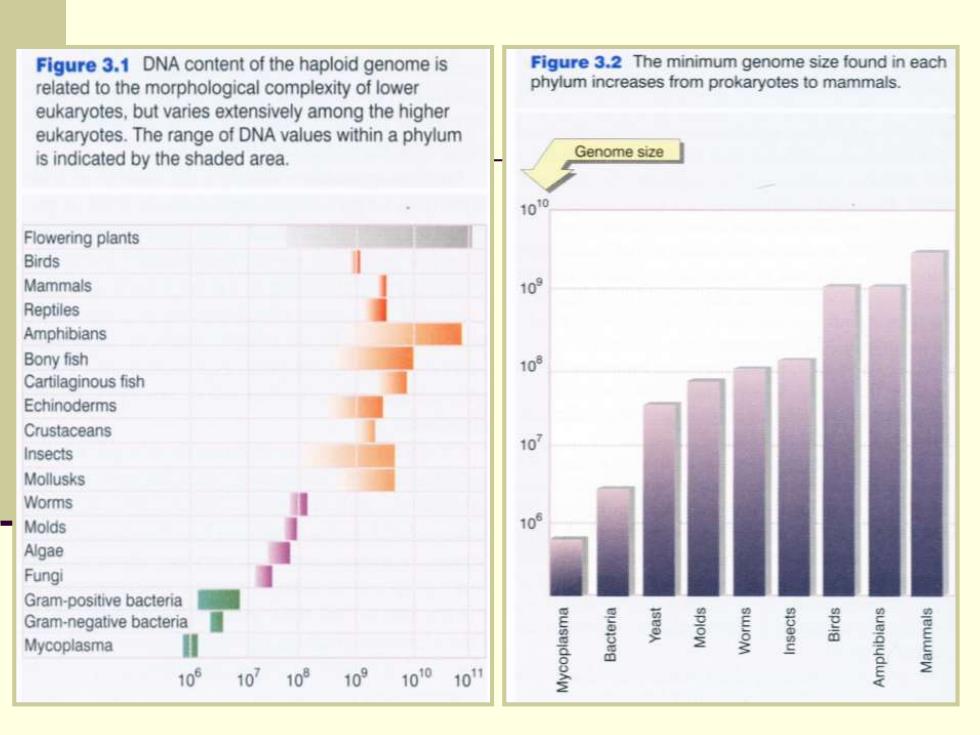
Figure 3.1 DNA content of the haploid genome is Figure 3.2 The minimum genome size found in each related to the morphological complexity of lower phylum increases from prokaryotes to mammals. eukaryotes,but varies extensively among the higher eukaryotes.The range of DNA values within a phylum is indicated by the shaded area. Genome size 100 Flowering plants Birds Mammals 109 Reptiles Amphibians Bony fish 10 Cartilaginous fish Echinoderms Crustaceans 10 Insects Mollusks Worms Molds 10 Algae Fungi Gram-positive bacteria Gram-negative bacteria Mycoplasma 105 10710 109 100 10