正在加载图片...

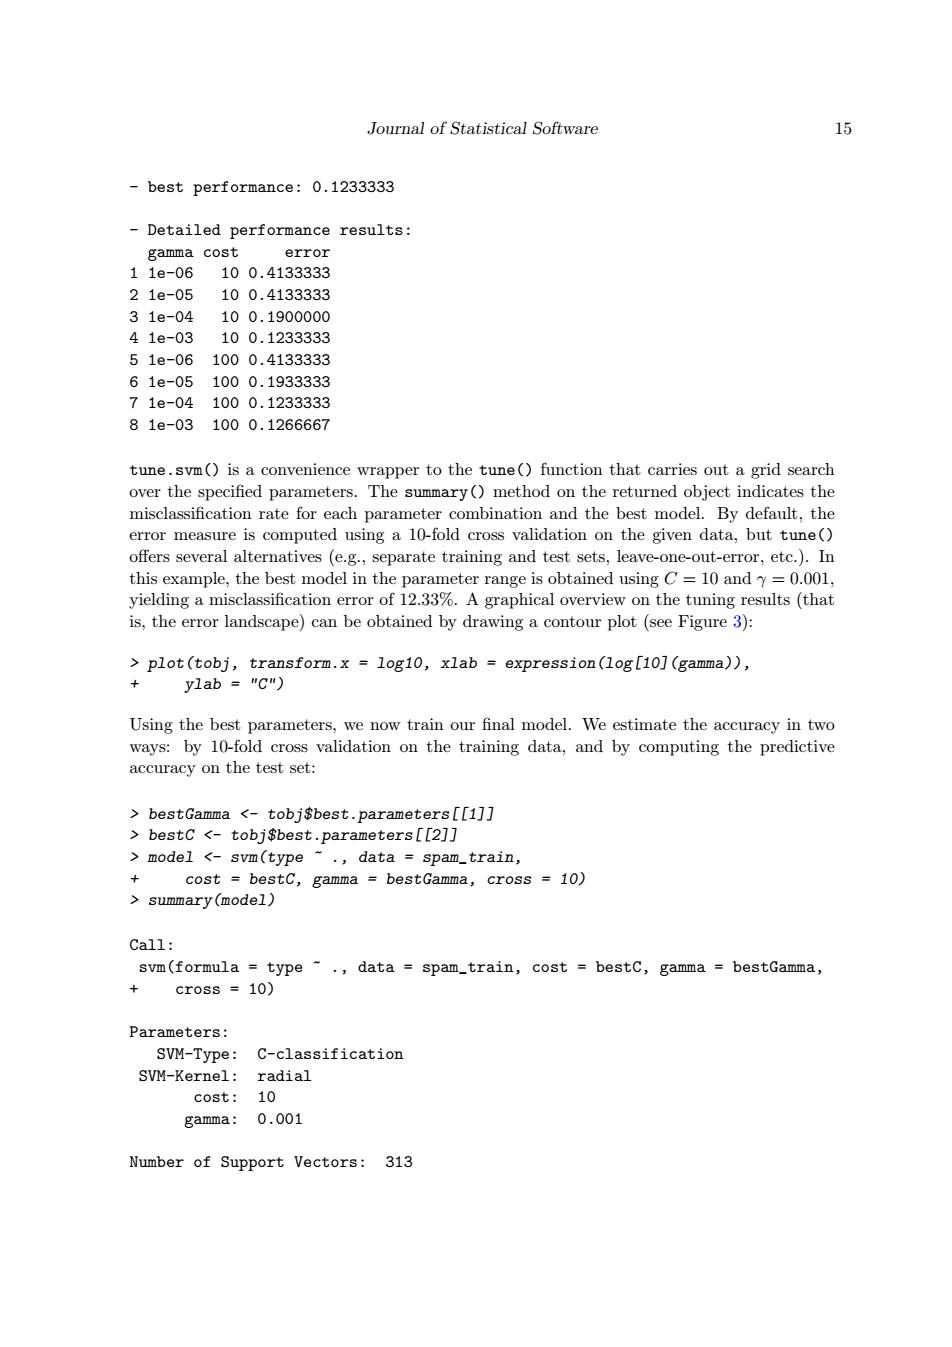
Journal of Statistical Software 15 best performance:0.1233333 Detailed performance results: gamma cost error 11e-06 100.4133333 21e-05 100.4133333 31e-04 100.1900000 41e-03 100.1233333 51e-061000.4133333 61e-051000.1933333 71e-041000.1233333 81e-031000.1266667 tune.svm()is a convenience wrapper to the tune()function that carries out a grid search over the specified parameters.The summary()method on the returned object indicates the misclassification rate for each parameter combination and the best model.By default,the error measure is computed using a 10-fold cross validation on the given data,but tune() offers several alternatives (e.g.,separate training and test sets,leave-one-out-error,etc.).In this example,the best model in the parameter range is obtained using C=10 and y=0.001, yielding a misclassification error of 12.33%.A graphical overview on the tuning results (that is,the error landscape)can be obtained by drawing a contour plot (see Figure 3): plot(tobj,transform.x l0g10,xlab expression(log[10](gamma)), ylab ="C") Using the best parameters,we now train our final model.We estimate the accuracy in two ways:by 10-fold cross validation on the training data,and by computing the predictive accuracy on the test set: bestGamma <-tobj$best.parameters[[1]] bestC <-tobj$best.parameters[[2]] >model <-svm(type ~.data spam_train, + cost =bestC,gamma =bestGamma,cross =10) summary(model) Call: svm(formula type ~.data spam_train,cost bestC,gamma bestGamma, cross 10) Parameters: SVM-Type:C-classification SVM-Kernel: radial cost: 10 gamma: 0.001 Number of Support Vectors:313Journal of Statistical Software 15 - best performance: 0.1233333 - Detailed performance results: gamma cost error 1 1e-06 10 0.4133333 2 1e-05 10 0.4133333 3 1e-04 10 0.1900000 4 1e-03 10 0.1233333 5 1e-06 100 0.4133333 6 1e-05 100 0.1933333 7 1e-04 100 0.1233333 8 1e-03 100 0.1266667 tune.svm() is a convenience wrapper to the tune() function that carries out a grid search over the specified parameters. The summary() method on the returned object indicates the misclassification rate for each parameter combination and the best model. By default, the error measure is computed using a 10-fold cross validation on the given data, but tune() offers several alternatives (e.g., separate training and test sets, leave-one-out-error, etc.). In this example, the best model in the parameter range is obtained using C = 10 and γ = 0.001, yielding a misclassification error of 12.33%. A graphical overview on the tuning results (that is, the error landscape) can be obtained by drawing a contour plot (see Figure 3): > plot(tobj, transform.x = log10, xlab = expression(log[10](gamma)), + ylab = "C") Using the best parameters, we now train our final model. We estimate the accuracy in two ways: by 10-fold cross validation on the training data, and by computing the predictive accuracy on the test set: > bestGamma <- tobj$best.parameters[[1]] > bestC <- tobj$best.parameters[[2]] > model <- svm(type ~ ., data = spam_train, + cost = bestC, gamma = bestGamma, cross = 10) > summary(model) Call: svm(formula = type ~ ., data = spam_train, cost = bestC, gamma = bestGamma, + cross = 10) Parameters: SVM-Type: C-classification SVM-Kernel: radial cost: 10 gamma: 0.001 Number of Support Vectors: 313