正在加载图片...
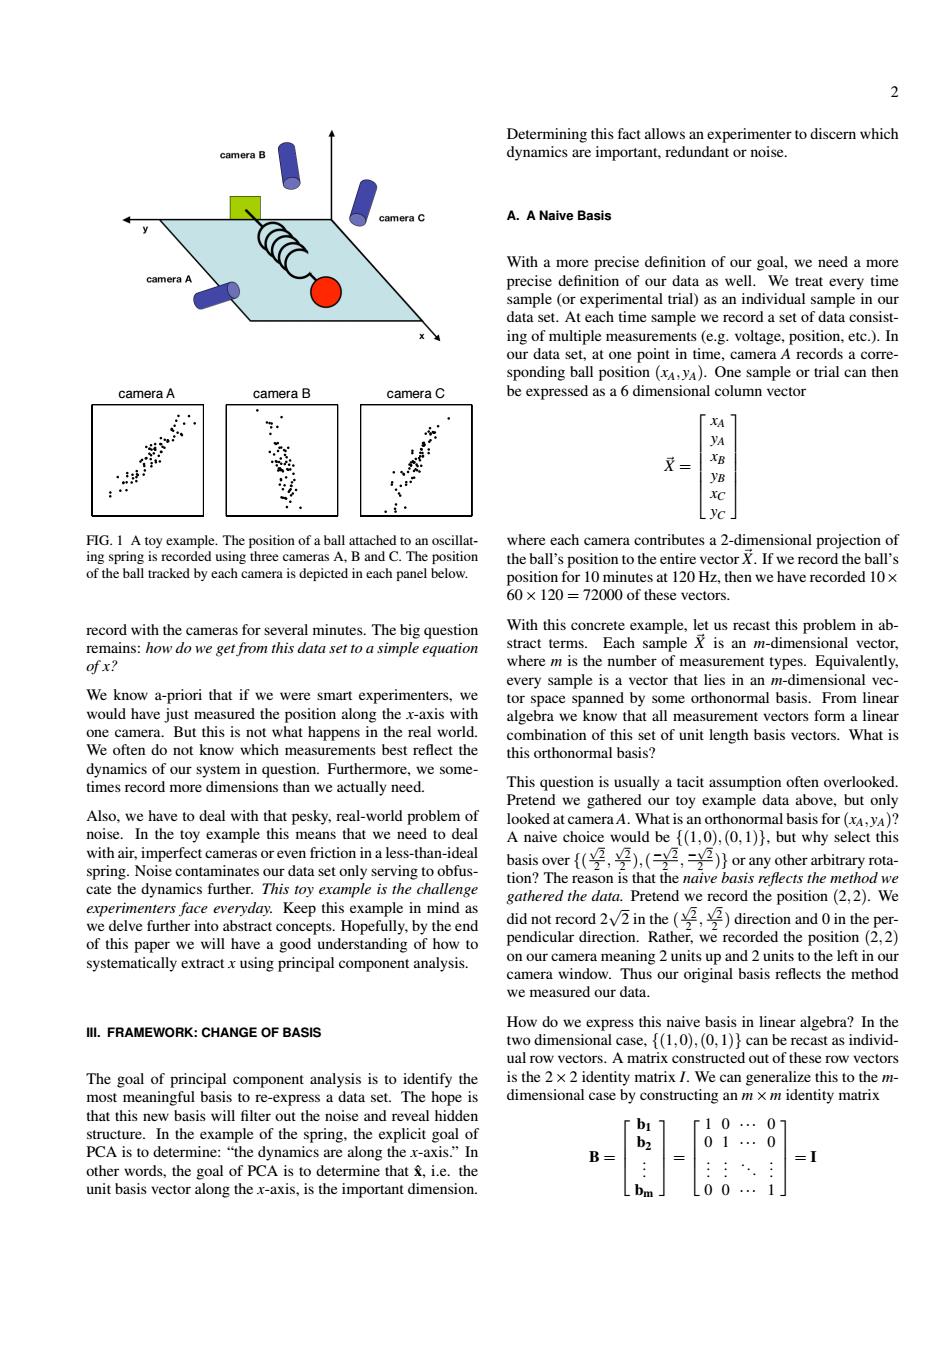
Determining this fact allows an experimenter to discern which dynamics are important,redundant or noise. amera C A.A Naive Basis With a more precise definition of our goal,we need a more precise definition of our data as well.We treat every time sample(or experimental trial)as an individual sample in our data set.At each time sample we record a set of data consist- ing of multiple measurements (e.g.voltage,position,etc.).In our data set,at one point in time,camera A records a corre- sponding ball position (xA,yA).One sample or trial can then camera A camera B camera C be expressed as a 6 dimensional column vector XA yA XB YB XC FIG.1 A toy example.The position of a ball attached to an oscillat- where each camera contributes a 2-dimensional projection of ing spring is recorded using three cameras A,B and C.The position the ball's position to the entire vector X.If we record the ball's of the ball tracked by each camera is depicted in each panel below. position for 10 minutes at 120 Hz,then we have recorded 10x 60x 120=72000 of these vectors. record with the cameras for several minutes.The big question With this concrete example,let us recast this problem in ab- remains:how do we get from this data set to a simple equation stract terms.Each sample X is an m-dimensional vector, ofx? where m is the number of measurement types.Equivalently, every sample is a vector that lies in an m-dimensional vec- We know a-priori that if we were smart experimenters,we tor space spanned by some orthonormal basis.From linear would have just measured the position along the x-axis with algebra we know that all measurement vectors form a linear one camera.But this is not what happens in the real world. combination of this set of unit length basis vectors.What is We often do not know which measurements best reflect the this orthonormal basis? dynamics of our system in question.Furthermore,we some- times record more dimensions than we actually need. This question is usually a tacit assumption often overlooked. Pretend we gathered our toy example data above,but only Also,we have to deal with that pesky,real-world problem of looked at cameraA.What is an orthonormal basis for(xA,yA)? noise.In the toy example this means that we need to deal A naive choice would be {(1,0),(0,1)},but why select this with air,imperfect cameras or even friction in a less-than-ideal basis over(),(,=2)}or any other arbitrary rota- spring.Noise contaminates our data set only serving to obfus- tion?The reason is that the naive basis refects the method we cate the dynamics further.This toy example is the challenge gathered the data.Pretend we record the position (2,2).We experimenters face everyday.Keep this example in mind as we delve further into abstract concepts.Hopefully,by the end did not record2in the (direction and 0in the per- of this paper we will have a good understanding of how to pendicular direction.Rather,we recorded the position(2,2) systematically extract x using principal component analysis. on our camera meaning 2 units up and 2 units to the left in our camera window.Thus our original basis reflects the method we measured our data. Ill.FRAMEWORK:CHANGE OF BASIS How do we express this naive basis in linear algebra?In the two dimensional case,(1,0),(0,1)can be recast as individ- ual row vectors.A matrix constructed out of these row vectors The goal of principal component analysis is to identify the is the 2 x 2 identity matrix I.We can generalize this to the m- most meaningful basis to re-express a data set.The hope is dimensional case by constructing an m x m identity matrix that this new basis will filter out the noise and reveal hidden f10..01 structure.In the example of the spring,the explicit goal of b2 01.0 PCA is to determine:"the dynamics are along the x-axis."In other words,the goal of PCA is to determine that &i.e.the unit basis vector along the x-axis,is the important dimension. bm 200..2 camera A camera B camera C FIG. 1 A toy example. The position of a ball attached to an oscillating spring is recorded using three cameras A, B and C. The position of the ball tracked by each camera is depicted in each panel below. record with the cameras for several minutes. The big question remains: how do we get from this data set to a simple equation of x? We know a-priori that if we were smart experimenters, we would have just measured the position along the x-axis with one camera. But this is not what happens in the real world. We often do not know which measurements best reflect the dynamics of our system in question. Furthermore, we sometimes record more dimensions than we actually need. Also, we have to deal with that pesky, real-world problem of noise. In the toy example this means that we need to deal with air, imperfect cameras or even friction in a less-than-ideal spring. Noise contaminates our data set only serving to obfuscate the dynamics further. This toy example is the challenge experimenters face everyday. Keep this example in mind as we delve further into abstract concepts. Hopefully, by the end of this paper we will have a good understanding of how to systematically extract x using principal component analysis. III. FRAMEWORK: CHANGE OF BASIS The goal of principal component analysis is to identify the most meaningful basis to re-express a data set. The hope is that this new basis will filter out the noise and reveal hidden structure. In the example of the spring, the explicit goal of PCA is to determine: “the dynamics are along the x-axis.” In other words, the goal of PCA is to determine that xˆ, i.e. the unit basis vector along the x-axis, is the important dimension. Determining this fact allows an experimenter to discern which dynamics are important, redundant or noise. A. A Naive Basis With a more precise definition of our goal, we need a more precise definition of our data as well. We treat every time sample (or experimental trial) as an individual sample in our data set. At each time sample we record a set of data consisting of multiple measurements (e.g. voltage, position, etc.). In our data set, at one point in time, camera A records a corresponding ball position (xA,yA). One sample or trial can then be expressed as a 6 dimensional column vector ~X = xA yA xB yB xC yC where each camera contributes a 2-dimensional projection of the ball’s position to the entire vector ~X. If we record the ball’s position for 10 minutes at 120 Hz, then we have recorded 10× 60×120 = 72000 of these vectors. With this concrete example, let us recast this problem in abstract terms. Each sample ~X is an m-dimensional vector, where m is the number of measurement types. Equivalently, every sample is a vector that lies in an m-dimensional vector space spanned by some orthonormal basis. From linear algebra we know that all measurement vectors form a linear combination of this set of unit length basis vectors. What is this orthonormal basis? This question is usually a tacit assumption often overlooked. Pretend we gathered our toy example data above, but only looked at camera A. What is an orthonormal basis for(xA,yA)? A naive choice would be {(1,0),(0,1)}, but why select this basis over {( √ 2 2 , √ 2 2 ),( − √ 2 2 , − √ 2 2 )} or any other arbitrary rotation? The reason is that the naive basis reflects the method we gathered the data. Pretend we record the position (2,2). We did not record 2√ 2 in the ( √ 2 2 , √ 2 2 ) direction and 0 in the perpendicular direction. Rather, we recorded the position (2,2) on our camera meaning 2 units up and 2 units to the left in our camera window. Thus our original basis reflects the method we measured our data. How do we express this naive basis in linear algebra? In the two dimensional case, {(1,0),(0,1)} can be recast as individual row vectors. A matrix constructed out of these row vectors is the 2×2 identity matrix I. We can generalize this to the mdimensional case by constructing an m×m identity matrix B = b1 b2 . . . bm = 1 0 ··· 0 0 1 ··· 0 . . . . . . . . . . . . 0 0 ··· 1 = I