正在加载图片...
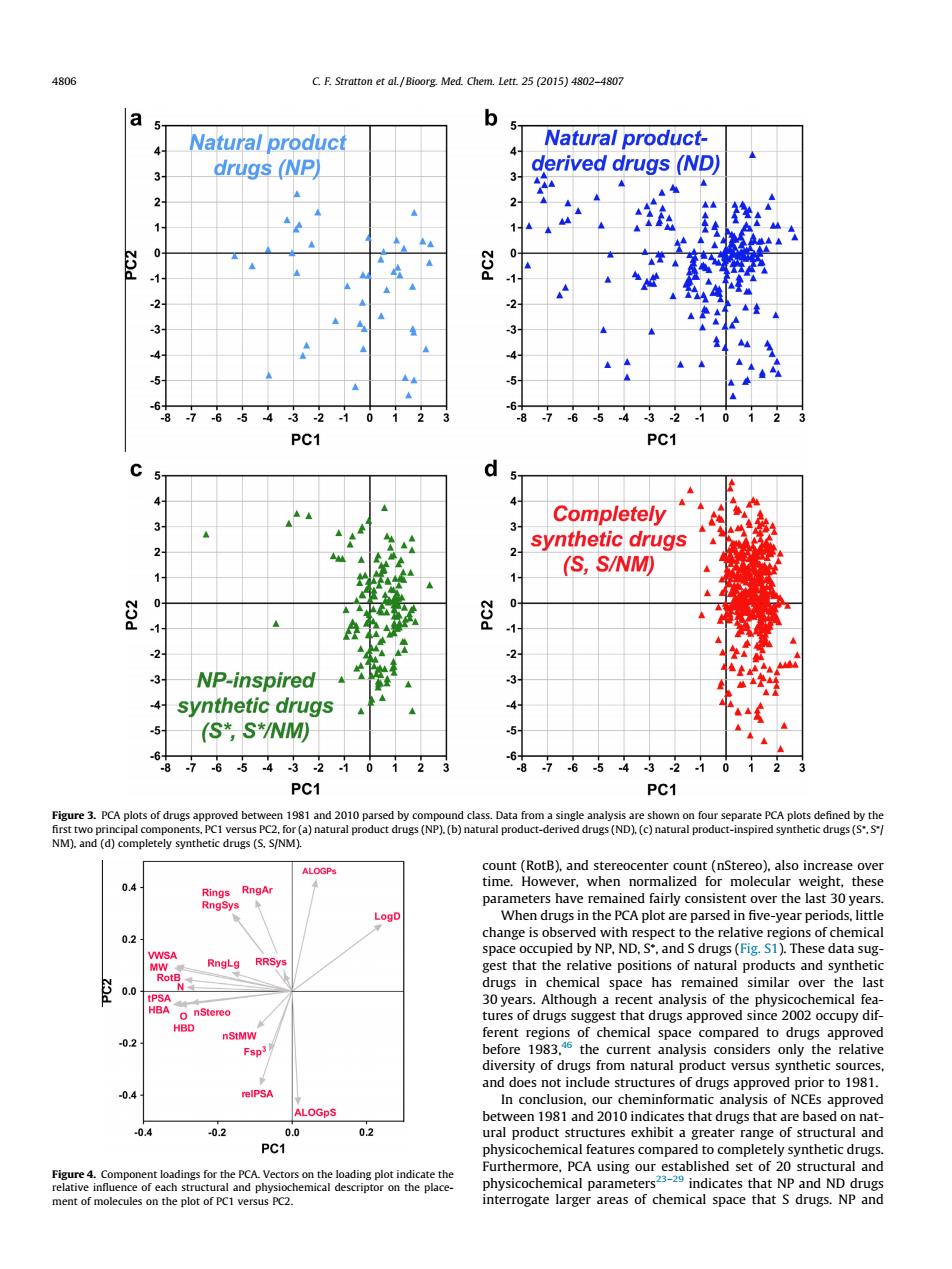
C.F.et al/Bioorg Med.Chem.Lett.25 (2015)402-4807 a b Natural product Natural product- 4 drugs(NP) derived drugs (ND) 2 -3 .5 PC1 PC1 3 Completely synthetic drugs 2 2 (S,S/NM) 0 31 NP-inspired 91 4 synthetic drugs (S*,S*/NM) 6876543210123 6876543210123 PC1 PC1 ocenter count(nStereo)also increa 04 eearpeniodts,litig 0.2 spac occupied by NP,ND.ands drugs()The data su in emical space has remained similar over the last st that drugs appr rsity of drugs from naturalpr duct versus sy 04 In con ion.02010 04 02 0 02 PC1 Furthermore.PCA using ou ural and interrogate of chemical space that s druss NPand count (RotB), and stereocenter count (nStereo), also increase over time. However, when normalized for molecular weight, these parameters have remained fairly consistent over the last 30 years. When drugs in the PCA plot are parsed in five-year periods, little change is observed with respect to the relative regions of chemical space occupied by NP, ND, S⁄ , and S drugs (Fig. S1). These data suggest that the relative positions of natural products and synthetic drugs in chemical space has remained similar over the last 30 years. Although a recent analysis of the physicochemical features of drugs suggest that drugs approved since 2002 occupy different regions of chemical space compared to drugs approved before 1983,46 the current analysis considers only the relative diversity of drugs from natural product versus synthetic sources, and does not include structures of drugs approved prior to 1981. In conclusion, our cheminformatic analysis of NCEs approved between 1981 and 2010 indicates that drugs that are based on natural product structures exhibit a greater range of structural and physicochemical features compared to completely synthetic drugs. Furthermore, PCA using our established set of 20 structural and physicochemical parameters23–29 indicates that NP and ND drugs interrogate larger areas of chemical space that S drugs. NP and Figure 3. PCA plots of drugs approved between 1981 and 2010 parsed by compound class. Data from a single analysis are shown on four separate PCA plots defined by the first two principal components, PC1 versus PC2, for (a) natural product drugs (NP), (b) natural product-derived drugs (ND), (c) natural product-inspired synthetic drugs (S⁄ , S⁄ / NM), and (d) completely synthetic drugs (S, S/NM). Figure 4. Component loadings for the PCA. Vectors on the loading plot indicate the relative influence of each structural and physiochemical descriptor on the placement of molecules on the plot of PC1 versus PC2. 4806 C. F. Stratton et al. / Bioorg. Med. Chem. Lett. 25 (2015) 4802–4807