正在加载图片...
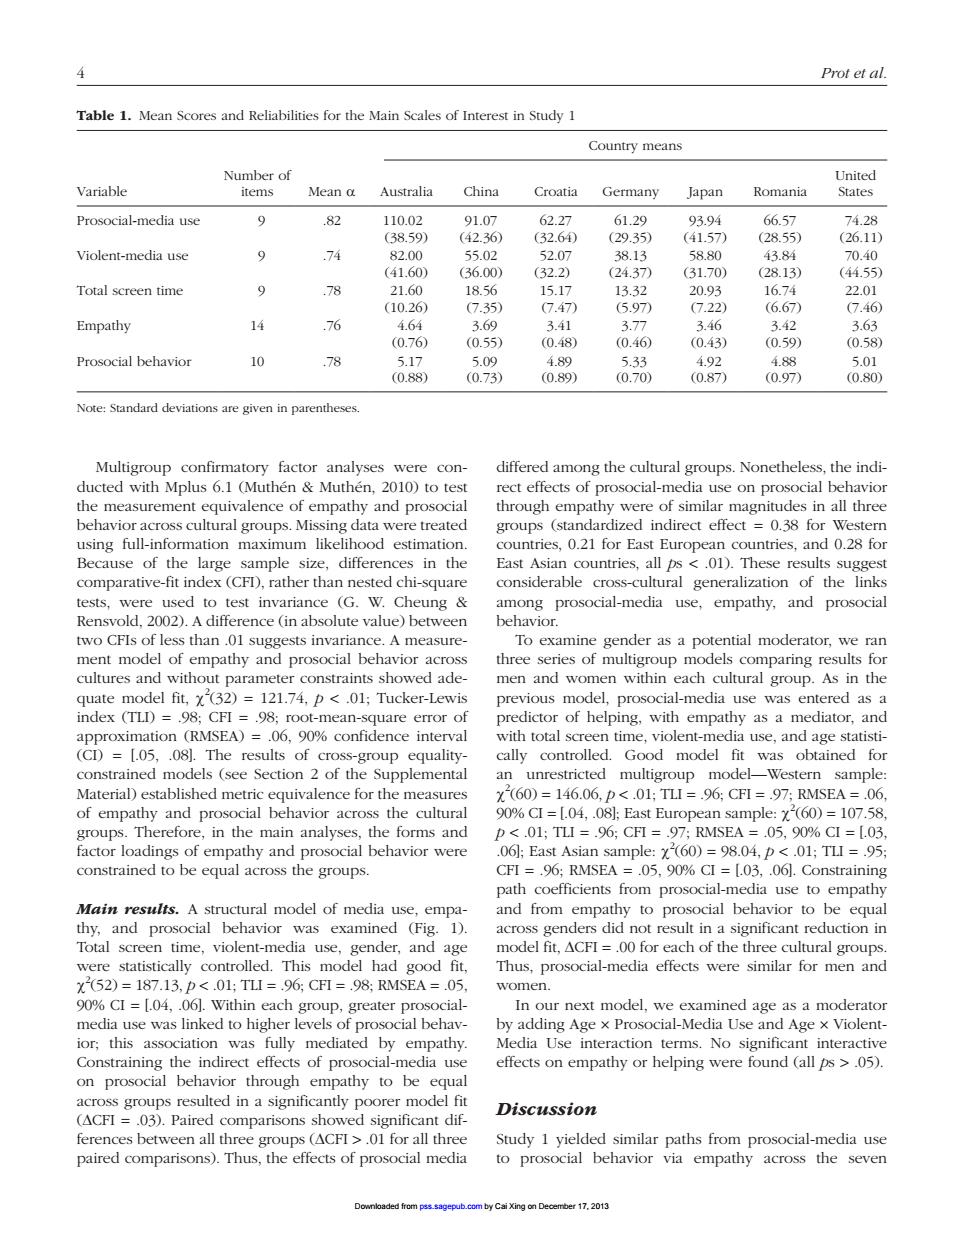
Prot et al. Table 1.Mean Scores and Reliabilities for the Main Scales of Interest in Study 1 Country means Variable Mean a Australia China Croatia Germany lapan Romania Prosocial-media use 9 916 612 65 Violent-media use .74 82.00 55.02 520 38.13 58 43.8 70 Total screen time 9 78 (160 (10.26 7.47) 597 6.67 746 Empathy 14 .76 46 Prosocial behavior 10 8 5.17 5.09 (0.73) are given in parenthese Multigroup confirmatory factor analyses were con- differed among the cultural groups.Nonetheless,the indi- ducted with Mplus 6.1 (Muthen&Muthen,2010)to test rect effects of prosocial-media use on prosocial behavio through empathy were all thre group 0.21 for East E ect Because of the large sample size,differences in the East Asian countries.all).These results sugges comparative-fit index(CFD),rather than nested chi-square considerable cross-cultural generalization of the links 【est invan among prosocial-media use,empathy,and prosocial nce (in a 01 rondler as a tial moderator ment model of empathy and prosocial behavior across cultures and without parameter constraints showed ade- men and women within each cultural group.As in the 121.74,p <.01;Tucker-Lewis prosocial-media use was entered as a ion (RMSEA ng.viole y as a mediator,an (CD 1.05.081.The results of cross cally controlled Good model fit was obtained for constrained models (see Section 2 of the Supplemental an unrestricted multigroup model -Western sample Material)established metri ic equivalence for the measure (60) 146.06, P .01:Tu=96CF1= RMSEA =.0 the cultur. 90%CG1 factor loadings of empathy and prosocial behavior were t Asian sample:(60)=98.04.p 01.TmI=0 constrained to be equal across the groups. CFI=96;RMSEA =.05,90%CI=103,06].Constraining path coefficients from prosocial-media use to empath A ed to pro be equa t in time violent media ag Thus.prosocial-media effects were similar for men and 13.p<.01:T1I=.96CF1=98:RMSEA= women hi group,greater d r next m del,we amine as a m ior this as was fully mediated by Constraining the indirect effects of prosocial-media us effects on empathy or helping were found (all ps>05). on prosocial behavior through empathy to be equal nuy po Discussion ces h s (ACEI 01 for all thre Study 1 vielded similar paths fror ocial-media use paired comparisons).Thus,the effects of prosocial media to prosocial behavior via empathy across the seven4 Prot et al. Multigroup confirmatory factor analyses were conducted with Mplus 6.1 (Muthén & Muthén, 2010) to test the measurement equivalence of empathy and prosocial behavior across cultural groups. Missing data were treated using full-information maximum likelihood estimation. Because of the large sample size, differences in the comparative-fit index (CFI), rather than nested chi-square tests, were used to test invariance (G. W. Cheung & Rensvold, 2002). A difference (in absolute value) between two CFIs of less than .01 suggests invariance. A measurement model of empathy and prosocial behavior across cultures and without parameter constraints showed adequate model fit, χ2 (32) = 121.74, p < .01; Tucker-Lewis index (TLI) = .98; CFI = .98; root-mean-square error of approximation (RMSEA) = .06, 90% confidence interval (CI) = [.05, .08]. The results of cross-group equalityconstrained models (see Section 2 of the Supplemental Material) established metric equivalence for the measures of empathy and prosocial behavior across the cultural groups. Therefore, in the main analyses, the forms and factor loadings of empathy and prosocial behavior were constrained to be equal across the groups. Main results. A structural model of media use, empathy, and prosocial behavior was examined (Fig. 1). Total screen time, violent-media use, gender, and age were statistically controlled. This model had good fit, χ2 (52) = 187.13, p < .01; TLI = .96; CFI = .98; RMSEA = .05, 90% CI = [.04, .06]. Within each group, greater prosocialmedia use was linked to higher levels of prosocial behavior; this association was fully mediated by empathy. Constraining the indirect effects of prosocial-media use on prosocial behavior through empathy to be equal across groups resulted in a significantly poorer model fit (ΔCFI = .03). Paired comparisons showed significant differences between all three groups (ΔCFI > .01 for all three paired comparisons). Thus, the effects of prosocial media differed among the cultural groups. Nonetheless, the indirect effects of prosocial-media use on prosocial behavior through empathy were of similar magnitudes in all three groups (standardized indirect effect = 0.38 for Western countries, 0.21 for East European countries, and 0.28 for East Asian countries, all ps < .01). These results suggest considerable cross-cultural generalization of the links among prosocial-media use, empathy, and prosocial behavior. To examine gender as a potential moderator, we ran three series of multigroup models comparing results for men and women within each cultural group. As in the previous model, prosocial-media use was entered as a predictor of helping, with empathy as a mediator, and with total screen time, violent-media use, and age statistically controlled. Good model fit was obtained for an unrestricted multigroup model—Western sample: χ2 (60) = 146.06, p < .01; TLI = .96; CFI = .97; RMSEA = .06, 90% CI = [.04, .08]; East European sample: χ2 (60) = 107.58, p < .01; TLI = .96; CFI = .97; RMSEA = .05, 90% CI = [.03, .06]; East Asian sample: χ2 (60) = 98.04, p < .01; TLI = .95; CFI = .96; RMSEA = .05, 90% CI = [.03, .06]. Constraining path coefficients from prosocial-media use to empathy and from empathy to prosocial behavior to be equal across genders did not result in a significant reduction in model fit, ΔCFI = .00 for each of the three cultural groups. Thus, prosocial-media effects were similar for men and women. In our next model, we examined age as a moderator by adding Age × Prosocial-Media Use and Age × ViolentMedia Use interaction terms. No significant interactive effects on empathy or helping were found (all ps > .05). Discussion Study 1 yielded similar paths from prosocial-media use to prosocial behavior via empathy across the seven Table 1. Mean Scores and Reliabilities for the Main Scales of Interest in Study 1 Country means Variable Number of items Mean α Australia China Croatia Germany Japan Romania United States Prosocial-media use 9 .82 110.02 (38.59) 91.07 (42.36) 62.27 (32.64) 61.29 (29.35) 93.94 (41.57) 66.57 (28.55) 74.28 (26.11) Violent-media use 9 .74 82.00 (41.60) 55.02 (36.00) 52.07 (32.2) 38.13 (24.37) 58.80 (31.70) 43.84 (28.13) 70.40 (44.55) Total screen time 9 .78 21.60 (10.26) 18.56 (7.35) 15.17 (7.47) 13.32 (5.97) 20.93 (7.22) 16.74 (6.67) 22.01 (7.46) Empathy 14 .76 4.64 (0.76) 3.69 (0.55) 3.41 (0.48) 3.77 (0.46) 3.46 (0.43) 3.42 (0.59) 3.63 (0.58) Prosocial behavior 10 .78 5.17 (0.88) 5.09 (0.73) 4.89 (0.89) 5.33 (0.70) 4.92 (0.87) 4.88 (0.97) 5.01 (0.80) Note: Standard deviations are given in parentheses. Downloaded from pss.sagepub.com by Cai Xing on December 17, 2013