正在加载图片...
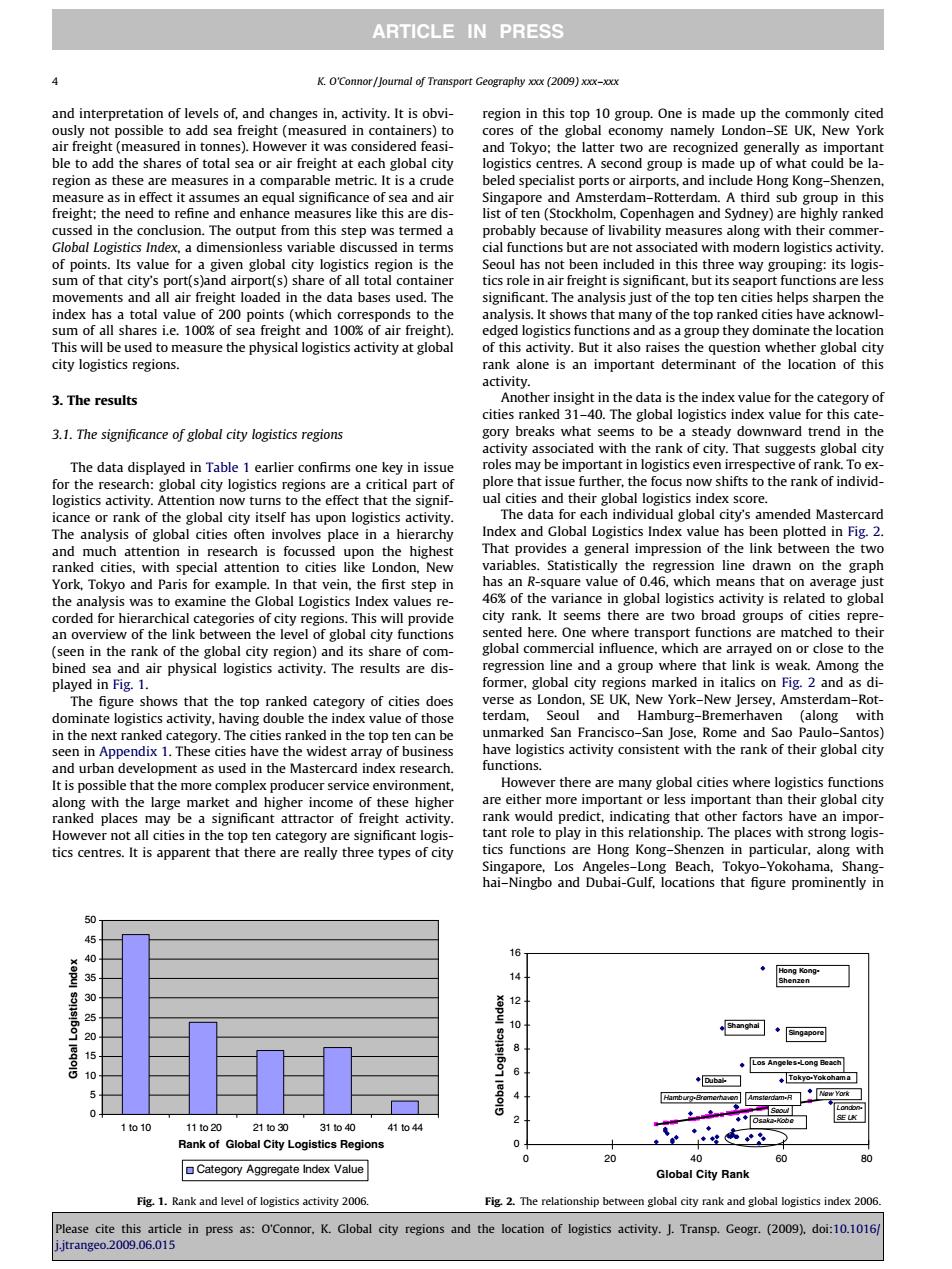
ARTICLE IN PRESS K.O'Connor /Journal of Transport Geography xxx(2009)xxx-xxx and interpretation of levels of,and changes in,activity.It is obvi- region in this top 10 group.One is made up the commonly cited ously not possible to add sea freight(measured in containers)to cores of the global economy namely London-SE UK.New York air freight(measured in tonnes).However it was considered feasi- and Tokyo:the latter two are recognized generally as important ble to add the shares of total sea or air freight at each global city logistics centres.A second group is made up of what could be la- region as these are measures in a comparable metric.It is a crude beled specialist ports or airports,and include Hong Kong-Shenzen measure as in effect it assumes an equal significance of sea and air Singapore and Amsterdam-Rotterdam.A third sub group in this freight;the need to refine and enhance measures like this are dis- list of ten(Stockholm,Copenhagen and Sydney)are highly ranked cussed in the conclusion.The output from this step was termed a probably because of livability measures along with their commer- Global Logistics Index,a dimensionless variable discussed in terms cial functions but are not associated with modern logistics activity. of points.Its value for a given global city logistics region is the Seoul has not been included in this three way grouping:its logis- sum of that city's port(s)and airport(s)share of all total container tics role in air freight is significant,but its seaport functions are less movements and all air freight loaded in the data bases used.The significant.The analysis just of the top ten cities helps sharpen the index has a total value of 200 points (which corresponds to the analysis.It shows that many of the top ranked cities have acknowl- sum of all shares i.e.100%of sea freight and 100%of air freight) edged logistics functions and as a group they dominate the location This will be used to measure the physical logistics activity at global of this activity.But it also raises the question whether global city city logistics regions. rank alone is an important determinant of the location of this activity. 3.The results Another insight in the data is the index value for the category of cities ranked 31-40.The global logistics index value for this cate- 3.1.The significance of global city logistics regions gory breaks what seems to be a steady downward trend in the activity associated with the rank of city.That suggests global city The data displayed in Table 1 earlier confirms one key in issue roles may be important in logistics even irrespective of rank.To ex- for the research:global city logistics regions are a critical part of plore that issue further,the focus now shifts to the rank of individ- logistics activity.Attention now turns to the effect that the signif- ual cities and their global logistics index score. icance or rank of the global city itself has upon logistics activity. The data for each individual global city's amended Mastercard The analysis of global cities often involves place in a hierarchy Index and Global Logistics Index value has been plotted in Fig.2. and much attention in research is focussed upon the highest That provides a general impression of the link between the two ranked cities,with special attention to cities like London,New variables.Statistically the regression line drawn on the graph York,Tokyo and Paris for example.In that vein,the first step in has an R-square value of 0.46,which means that on average just the analysis was to examine the Global Logistics Index values re- 46%of the variance in global logistics activity is related to global corded for hierarchical categories of city regions.This will provide city rank.It seems there are two broad groups of cities repre- an overview of the link between the level of global city functions sented here.One where transport functions are matched to their (seen in the rank of the global city region)and its share of com- global commercial influence,which are arrayed on or close to the bined sea and air physical logistics activity.The results are dis- regression line and a group where that link is weak.Among the played in Fig.1. former,global city regions marked in italics on Fig.2 and as di- The figure shows that the top ranked category of cities does verse as London,SE UK,New York-New Jersey,Amsterdam-Rot- dominate logistics activity,having double the index value of those terdam,Seoul and Hamburg-Bremerhaven (along with in the next ranked category.The cities ranked in the top ten can be unmarked San Francisco-San Jose,Rome and Sao Paulo-Santos) seen in Appendix 1.These cities have the widest array of business have logistics activity consistent with the rank of their global city and urban development as used in the Mastercard index research. functions. It is possible that the more complex producer service environment, However there are many global cities where logistics functions along with the large market and higher income of these higher are either more important or less important than their global city ranked places may be a significant attractor of freight activity. rank would predict,indicating that other factors have an impor- However not all cities in the top ten category are significant logis- tant role to play in this relationship.The places with strong logis- tics centres.It is apparent that there are really three types of city tics functions are Hong Kong-Shenzen in particular,along with Singapore,Los Angeles-Long Beach,Tokyo-Yokohama,Shang- hai-Ningbo and Dubai-Gulf,locations that figure prominently in 5 0 16 35 14 520 12 10 Shanghal ◆ngp0 15 8 ◆Los Angeles-Long Beach 10 6 ◆Duba☐ ◆Tokyo-Yokohama 4 mburg. S0ow 2 ◆Osaka-Kobe 1to10 11to20 21to30 31to40 41to44 Rank of Global City Logistics Regions 0 0 40 60 Category Aggregate Index Value Global City Rank Fig.1.Rank and level of logistics activity 2006. Fig.2.The relationship between global city rank and global logistics index 2006 Please cite this article in press as:O'Connor.K.Global city regions and the location of logistics activity.J.Transp.Geogr.(2009).doi:10.1016 j.jtrangeo.2009.06.015and interpretation of levels of, and changes in, activity. It is obviously not possible to add sea freight (measured in containers) to air freight (measured in tonnes). However it was considered feasible to add the shares of total sea or air freight at each global city region as these are measures in a comparable metric. It is a crude measure as in effect it assumes an equal significance of sea and air freight; the need to refine and enhance measures like this are discussed in the conclusion. The output from this step was termed a Global Logistics Index, a dimensionless variable discussed in terms of points. Its value for a given global city logistics region is the sum of that city’s port(s)and airport(s) share of all total container movements and all air freight loaded in the data bases used. The index has a total value of 200 points (which corresponds to the sum of all shares i.e. 100% of sea freight and 100% of air freight). This will be used to measure the physical logistics activity at global city logistics regions. 3. The results 3.1. The significance of global city logistics regions The data displayed in Table 1 earlier confirms one key in issue for the research: global city logistics regions are a critical part of logistics activity. Attention now turns to the effect that the significance or rank of the global city itself has upon logistics activity. The analysis of global cities often involves place in a hierarchy and much attention in research is focussed upon the highest ranked cities, with special attention to cities like London, New York, Tokyo and Paris for example. In that vein, the first step in the analysis was to examine the Global Logistics Index values recorded for hierarchical categories of city regions. This will provide an overview of the link between the level of global city functions (seen in the rank of the global city region) and its share of combined sea and air physical logistics activity. The results are displayed in Fig. 1. The figure shows that the top ranked category of cities does dominate logistics activity, having double the index value of those in the next ranked category. The cities ranked in the top ten can be seen in Appendix 1. These cities have the widest array of business and urban development as used in the Mastercard index research. It is possible that the more complex producer service environment, along with the large market and higher income of these higher ranked places may be a significant attractor of freight activity. However not all cities in the top ten category are significant logistics centres. It is apparent that there are really three types of city region in this top 10 group. One is made up the commonly cited cores of the global economy namely London–SE UK, New York and Tokyo; the latter two are recognized generally as important logistics centres. A second group is made up of what could be labeled specialist ports or airports, and include Hong Kong–Shenzen, Singapore and Amsterdam–Rotterdam. A third sub group in this list of ten (Stockholm, Copenhagen and Sydney) are highly ranked probably because of livability measures along with their commercial functions but are not associated with modern logistics activity. Seoul has not been included in this three way grouping: its logistics role in air freight is significant, but its seaport functions are less significant. The analysis just of the top ten cities helps sharpen the analysis. It shows that many of the top ranked cities have acknowledged logistics functions and as a group they dominate the location of this activity. But it also raises the question whether global city rank alone is an important determinant of the location of this activity. Another insight in the data is the index value for the category of cities ranked 31–40. The global logistics index value for this category breaks what seems to be a steady downward trend in the activity associated with the rank of city. That suggests global city roles may be important in logistics even irrespective of rank. To explore that issue further, the focus now shifts to the rank of individual cities and their global logistics index score. The data for each individual global city’s amended Mastercard Index and Global Logistics Index value has been plotted in Fig. 2. That provides a general impression of the link between the two variables. Statistically the regression line drawn on the graph has an R-square value of 0.46, which means that on average just 46% of the variance in global logistics activity is related to global city rank. It seems there are two broad groups of cities represented here. One where transport functions are matched to their global commercial influence, which are arrayed on or close to the regression line and a group where that link is weak. Among the former, global city regions marked in italics on Fig. 2 and as diverse as London, SE UK, New York–New Jersey, Amsterdam–Rotterdam, Seoul and Hamburg–Bremerhaven (along with unmarked San Francisco–San Jose, Rome and Sao Paulo–Santos) have logistics activity consistent with the rank of their global city functions. However there are many global cities where logistics functions are either more important or less important than their global city rank would predict, indicating that other factors have an important role to play in this relationship. The places with strong logistics functions are Hong Kong–Shenzen in particular, along with Singapore, Los Angeles–Long Beach, Tokyo–Yokohama, Shanghai–Ningbo and Dubai-Gulf, locations that figure prominently in 0 5 10 15 20 25 30 35 40 45 50 1 to 10 11 to 20 21 to 30 31 to 40 41 to 44 Rank of Global City Logistics Regions Global Logistics Index Category Aggregate Index Value Fig. 1. Rank and level of logistics activity 2006. 0 2 4 6 8 10 12 14 16 0 20 40 60 80 Global City Rank Global Logistics Index Singapore Hong KongShenzen Shanghai Los Angeles-Long Beach Tokyo-Yokohama DubaiLondonSE UK New York Seoul Hamburg-Bremerhaven Amsterdam-R Osaka-Kobe Fig. 2. The relationship between global city rank and global logistics index 2006. 4 K. O’Connor / Journal of Transport Geography xxx (2009) xxx–xxx ARTICLE IN PRESS Please cite this article in press as: O’Connor, K. Global city regions and the location of logistics activity. J. Transp. Geogr. (2009), doi:10.1016/ j.jtrangeo.2009.06.015