正在加载图片...
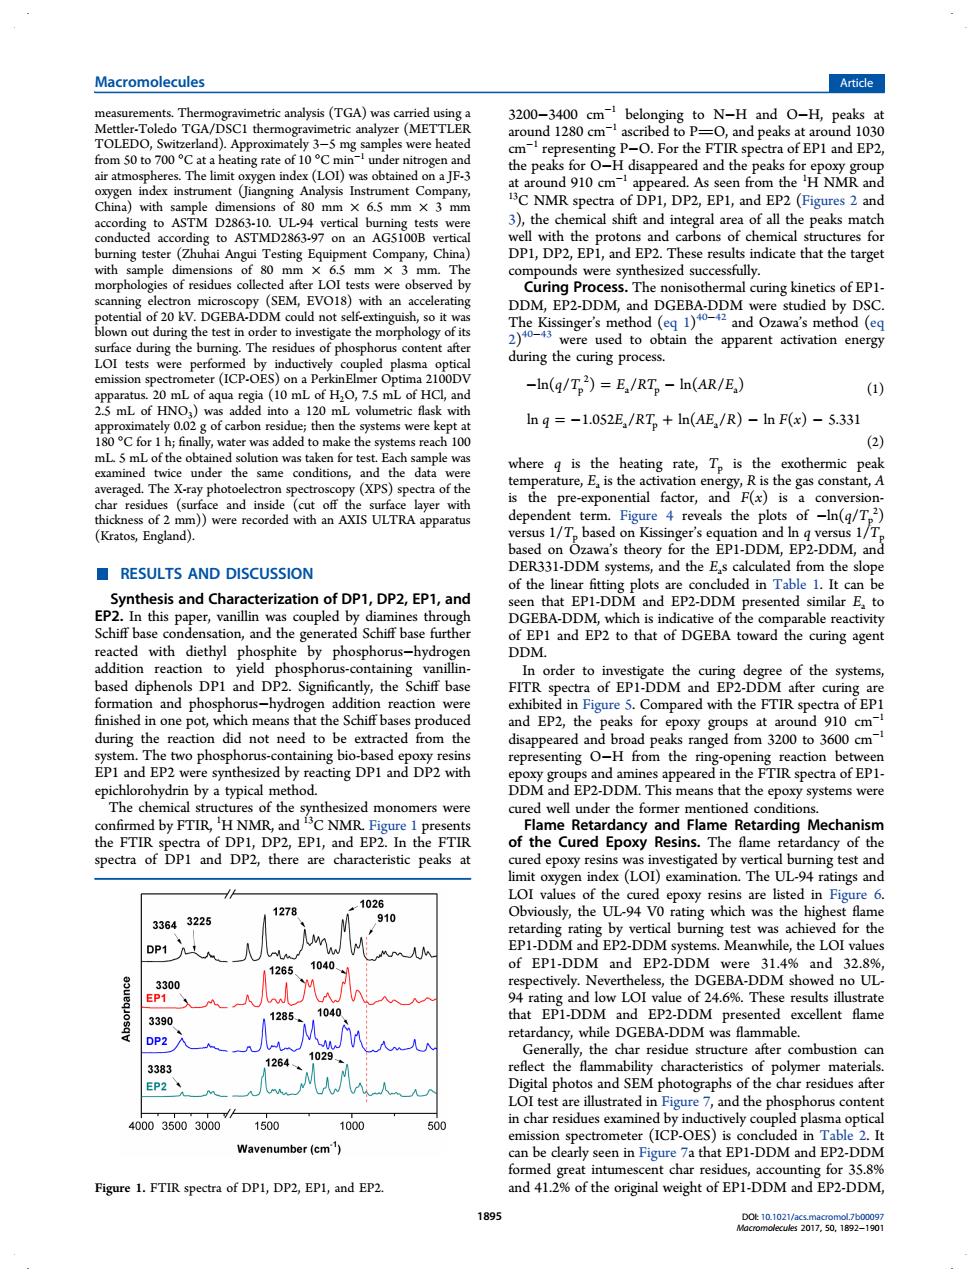
Macromolecules Article TGA/ analysis(TGA) rom 50 to 700 g rate the t (an 910cm 0 mm of DPL DP2 6.5m 3).the of all the aks n ns to 7 on an AGs 9 ere 20 kV.DGERA-DDM DDM,EP2-DDM,and DGEBA-DDM ere studied by DSC and 0awde od (ec of pl d during the curing process. (ICP Pe -ln(q/T')=E./RT,-ln(AR/E,) (1) ng=-1.052E,/RT+ln(AE,/R)-lnF(x)-5.33 5 mL of the oby The (XPS)s F(x)is with an AXIS ULTRA apparatus 1/7 for the EPI EP2-DDM RESULTS AND DISCUSSION DER331-DDM ss from the slo of the ed in Table 1.It car rapablereac diethy osphite by phosphoru system ls DPl and DP2 Signific tly the Schiff has and EP during the g0m3200o3600g EPI and EP2 were synthes ed by reacting DPI and DP2 with the ared in the DM.This ha the epoy systems were he N spectra of DPI and DP2.there are characteristic peaks ed by ver est and 026 1278 33643225 sy,中 ing vas th ighe EPI-DDN the 65 104 e300 the DCEBA-DDMo e UL A人 EPL-DDM 5%.Thes M 339 was DP2 126 the EP2、 ar res es afte 0035003000 500 in char res es examin (ICP-OES) mber (cm an be in Fig a that EP1-DDM d EP2-DD Figure 1.FTIR spectra of DP1,DP2,EP1,and EP2 and 412%of the priginal w ight of EPI-DDM and Ep2-DDMmeasurements. Thermogravimetric analysis (TGA) was carried using a Mettler-Toledo TGA/DSC1 thermogravimetric analyzer (METTLER TOLEDO, Switzerland). Approximately 3−5 mg samples were heated from 50 to 700 °C at a heating rate of 10 °C min−1 under nitrogen and air atmospheres. The limit oxygen index (LOI) was obtained on a JF-3 oxygen index instrument (Jiangning Analysis Instrument Company, China) with sample dimensions of 80 mm × 6.5 mm × 3 mm according to ASTM D2863-10. UL-94 vertical burning tests were conducted according to ASTMD2863-97 on an AG5100B vertical burning tester (Zhuhai Angui Testing Equipment Company, China) with sample dimensions of 80 mm × 6.5 mm × 3 mm. The morphologies of residues collected after LOI tests were observed by scanning electron microscopy (SEM, EVO18) with an accelerating potential of 20 kV. DGEBA-DDM could not self-extinguish, so it was blown out during the test in order to investigate the morphology of its surface during the burning. The residues of phosphorus content after LOI tests were performed by inductively coupled plasma optical emission spectrometer (ICP-OES) on a PerkinElmer Optima 2100DV apparatus. 20 mL of aqua regia (10 mL of H2O, 7.5 mL of HCl, and 2.5 mL of HNO3) was added into a 120 mL volumetric flask with approximately 0.02 g of carbon residue; then the systems were kept at 180 °C for 1 h; finally, water was added to make the systems reach 100 mL. 5 mL of the obtained solution was taken for test. Each sample was examined twice under the same conditions, and the data were averaged. The X-ray photoelectron spectroscopy (XPS) spectra of the char residues (surface and inside (cut off the surface layer with thickness of 2 mm)) were recorded with an AXIS ULTRA apparatus (Kratos, England). ■ RESULTS AND DISCUSSION Synthesis and Characterization of DP1, DP2, EP1, and EP2. In this paper, vanillin was coupled by diamines through Schiff base condensation, and the generated Schiff base further reacted with diethyl phosphite by phosphorus−hydrogen addition reaction to yield phosphorus-containing vanillinbased diphenols DP1 and DP2. Significantly, the Schiff base formation and phosphorus−hydrogen addition reaction were finished in one pot, which means that the Schiff bases produced during the reaction did not need to be extracted from the system. The two phosphorus-containing bio-based epoxy resins EP1 and EP2 were synthesized by reacting DP1 and DP2 with epichlorohydrin by a typical method. The chemical structures of the synthesized monomers were confirmed by FTIR, 1 H NMR, and 13C NMR. Figure 1 presents the FTIR spectra of DP1, DP2, EP1, and EP2. In the FTIR spectra of DP1 and DP2, there are characteristic peaks at 3200−3400 cm−1 belonging to N−H and O−H, peaks at around 1280 cm−1 ascribed to PO, and peaks at around 1030 cm−1 representing P−O. For the FTIR spectra of EP1 and EP2, the peaks for O−H disappeared and the peaks for epoxy group at around 910 cm−1 appeared. As seen from the 1 H NMR and 13C NMR spectra of DP1, DP2, EP1, and EP2 (Figures 2 and 3), the chemical shift and integral area of all the peaks match well with the protons and carbons of chemical structures for DP1, DP2, EP1, and EP2. These results indicate that the target compounds were synthesized successfully. Curing Process. The nonisothermal curing kinetics of EP1- DDM, EP2-DDM, and DGEBA-DDM were studied by DSC. The Kissinger’s method (eq 1) 40−42 and Ozawa’s method (eq 2) 40−43 were used to obtain the apparent activation energy during the curing process. − =− ln( / ) / ln( / ) q T E RT AR E p 2 ap a (1) ln 1.052 / ln( / ) ln ( ) 5.331 q E RT AE R F x =− + − − ap a (2) where q is the heating rate, Tp is the exothermic peak temperature, Ea is the activation energy, R is the gas constant, A is the pre-exponential factor, and F(x) is a conversiondependent term. Figure 4 reveals the plots of −ln(q/Tp 2 ) versus 1/Tp based on Kissinger’s equation and ln q versus 1/Tp based on Ozawa’s theory for the EP1-DDM, EP2-DDM, and DER331-DDM systems, and the Eas calculated from the slope of the linear fitting plots are concluded in Table 1. It can be seen that EP1-DDM and EP2-DDM presented similar Ea to DGEBA-DDM, which is indicative of the comparable reactivity of EP1 and EP2 to that of DGEBA toward the curing agent DDM. In order to investigate the curing degree of the systems, FITR spectra of EP1-DDM and EP2-DDM after curing are exhibited in Figure 5. Compared with the FTIR spectra of EP1 and EP2, the peaks for epoxy groups at around 910 cm−1 disappeared and broad peaks ranged from 3200 to 3600 cm−1 representing O−H from the ring-opening reaction between epoxy groups and amines appeared in the FTIR spectra of EP1- DDM and EP2-DDM. This means that the epoxy systems were cured well under the former mentioned conditions. Flame Retardancy and Flame Retarding Mechanism of the Cured Epoxy Resins. The flame retardancy of the cured epoxy resins was investigated by vertical burning test and limit oxygen index (LOI) examination. The UL-94 ratings and LOI values of the cured epoxy resins are listed in Figure 6. Obviously, the UL-94 V0 rating which was the highest flame retarding rating by vertical burning test was achieved for the EP1-DDM and EP2-DDM systems. Meanwhile, the LOI values of EP1-DDM and EP2-DDM were 31.4% and 32.8%, respectively. Nevertheless, the DGEBA-DDM showed no UL- 94 rating and low LOI value of 24.6%. These results illustrate that EP1-DDM and EP2-DDM presented excellent flame retardancy, while DGEBA-DDM was flammable. Generally, the char residue structure after combustion can reflect the flammability characteristics of polymer materials. Digital photos and SEM photographs of the char residues after LOI test are illustrated in Figure 7, and the phosphorus content in char residues examined by inductively coupled plasma optical emission spectrometer (ICP-OES) is concluded in Table 2. It can be clearly seen in Figure 7a that EP1-DDM and EP2-DDM formed great intumescent char residues, accounting for 35.8% Figure 1. FTIR spectra of DP1, DP2, EP1, and EP2. and 41.2% of the original weight of EP1-DDM and EP2-DDM, Macromolecules Article DOI: 10.1021/acs.macromol.7b00097 Macromolecules 2017, 50, 1892−1901 1895