正在加载图片...
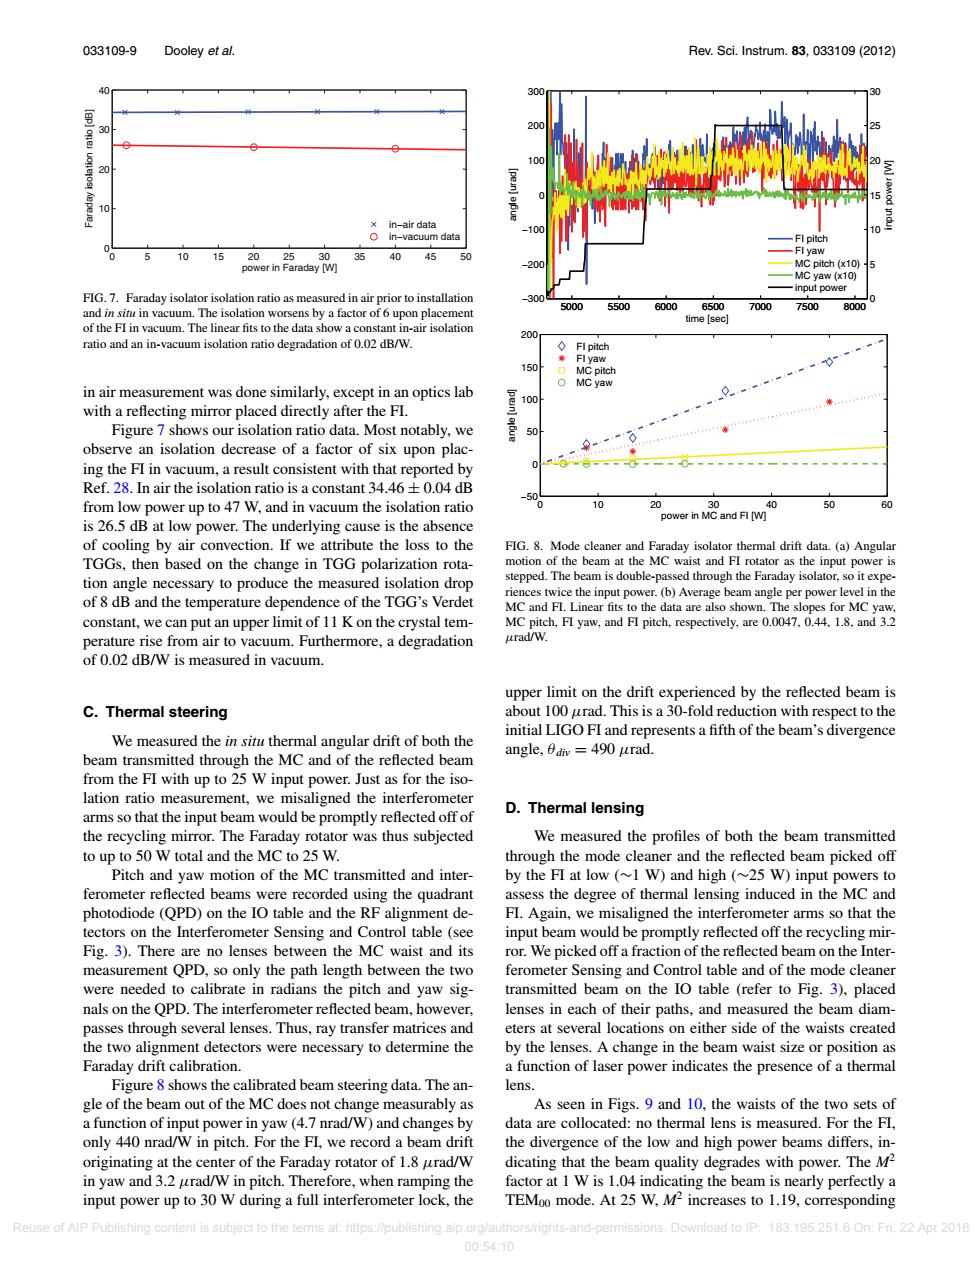
033109-9 Dooley et al. Rev.Sci.Instrum.83,033109(2012) 90 300 3 20 10 ×in-air data O in-vacuum data -Fl pitch 10 15 20 25 30 35 40 45 50 -Fl yaw power in Faraday [W) MC Ditch (x10) -MC yaw (x10) input power FIG.7.Faraday isolator isolation ratio as measured in air prior to installation and in sin in vacuum.The isolation worsens by a factor of 6 upon placement 5000 5500 6000 6500 7000 7500 8000 time [secl of the FI in vacuum.The linear fits to the data show a constant in-air isolation 200 ratio and an in-vacuum isolation ratio degradation of 0.02 dB/W. ◇FI pitch ◆Fl yaw 150 MC pitch o MC yaw in air measurement was done similarly,except in an optics lab 100 0 with a reflecting mirror placed directly after the FI. Figure 7 shows our isolation ratio data.Most notably,we observe an isolation decrease of a factor of six upon plac- ing the FI in vacuum,a result consistent with that reported by Ref.28.In air the isolation ratio is a constant 34.46+0.04 dB from low power up to 47 W,and in vacuum the isolation ratio 10 20 40 50 60 is 26.5 dB at low power.The underlying cause is the absence of cooling by air convection.If we attribute the loss to the FIG.8.Mode cleaner and Faraday isolator thermal drift data.(a)Angular TGGs,then based on the change in TGG polarization rota- motion of the beam at the MC waist and FI rotator as the input power is tion angle necessary to produce the measured isolation drop stepped.The beam is double-passed through the Faraday isolator,so it expe- riences twice the input power.(b)Average beam angle per power level in the of 8 dB and the temperature dependence of the TGG's Verdet MC and FI.Linear fits to the data are also shown.The slopes for MC yaw, constant,we can put an upper limit of 11 K on the crystal tem- MC pitch,FI yaw,and FI pitch,respectively,are 0.0047,0.44.1.8,and 3.2 perature rise from air to vacuum.Furthermore,a degradation urad/W. of 0.02 dB/W is measured in vacuum. upper limit on the drift experienced by the reflected beam is C.Thermal steering about 100 urad.This is a 30-fold reduction with respect to the initial LIGO FI and represents a fifth of the beam's divergence We measured the in situ thermal angular drift of both the beam transmitted through the MC and of the reflected beam angle,6div =490 urad. from the FI with up to 25 W input power.Just as for the iso- lation ratio measurement,we misaligned the interferometer arms so that the input beam would be promptly reflected off of D.Thermal lensing the recycling mirror.The Faraday rotator was thus subjected We measured the profiles of both the beam transmitted to up to 50 W total and the MC to 25 W. through the mode cleaner and the reflected beam picked off Pitch and yaw motion of the MC transmitted and inter- by the FI at low (~1 W)and high (~25 W)input powers to ferometer reflected beams were recorded using the quadrant assess the degree of thermal lensing induced in the MC and photodiode (QPD)on the IO table and the RF alignment de- FI.Again,we misaligned the interferometer arms so that the tectors on the Interferometer Sensing and Control table(see input beam would be promptly reflected off the recycling mir- Fig.3).There are no lenses between the MC waist and its ror.We picked off a fraction of the reflected beam on the Inter- measurement QPD,so only the path length between the two ferometer Sensing and Control table and of the mode cleaner were needed to calibrate in radians the pitch and yaw sig- transmitted beam on the IO table (refer to Fig.3).placed nals on the OPD.The interferometer reflected beam,however. lenses in each of their paths,and measured the beam diam- passes through several lenses.Thus,ray transfer matrices and eters at several locations on either side of the waists created the two alignment detectors were necessary to determine the by the lenses.A change in the beam waist size or position as Faraday drift calibration. a function of laser power indicates the presence of a thermal Figure 8 shows the calibrated beam steering data.The an- lens. gle of the beam out of the MC does not change measurably as As seen in Figs.9 and 10,the waists of the two sets of a function of input power in yaw(4.7 nrad/W)and changes by data are collocated:no thermal lens is measured.For the FI, only 440 nrad/W in pitch.For the FL we record a beam drift the divergence of the low and high power beams differs,in- originating at the center of the Faraday rotator of 1.8 urad/W dicating that the beam quality degrades with power.The M2 in yaw and 3.2 urad/W in pitch.Therefore,when ramping the factor at 1 W is 1.04 indicating the beam is nearly perfectly a input power up to 30 W during a full interferometer lock,the TEMoo mode.At 25 W,M2 increases to 1.19,corresponding Reuse of AlP Publishing content is subject to the terms at:https://publishing.aip.org/authors/rights-and-permissions.Download to IP:183.195.251.6 On:Fri.22 Apr 2016 00:54:10033109-9 Dooley et al. Rev. Sci. Instrum. 83, 033109 (2012) 0 5 10 15 20 25 30 35 40 45 50 0 10 20 30 40 power in Faraday [W] Faraday isolation ratio [dB] in−air data in−vacuum data FIG. 7. Faraday isolator isolation ratio as measured in air prior to installation and in situ in vacuum. The isolation worsens by a factor of 6 upon placement of the FI in vacuum. The linear fits to the data show a constant in-air isolation ratio and an in-vacuum isolation ratio degradation of 0.02 dB/W. in air measurement was done similarly, except in an optics lab with a reflecting mirror placed directly after the FI. Figure 7 shows our isolation ratio data. Most notably, we observe an isolation decrease of a factor of six upon placing the FI in vacuum, a result consistent with that reported by Ref. 28. In air the isolation ratio is a constant 34.46 ± 0.04 dB from low power up to 47 W, and in vacuum the isolation ratio is 26.5 dB at low power. The underlying cause is the absence of cooling by air convection. If we attribute the loss to the TGGs, then based on the change in TGG polarization rotation angle necessary to produce the measured isolation drop of 8 dB and the temperature dependence of the TGG’s Verdet constant, we can put an upper limit of 11 K on the crystal temperature rise from air to vacuum. Furthermore, a degradation of 0.02 dB/W is measured in vacuum. C. Thermal steering We measured the in situ thermal angular drift of both the beam transmitted through the MC and of the reflected beam from the FI with up to 25 W input power. Just as for the isolation ratio measurement, we misaligned the interferometer arms so that the input beam would be promptly reflected off of the recycling mirror. The Faraday rotator was thus subjected to up to 50 W total and the MC to 25 W. Pitch and yaw motion of the MC transmitted and interferometer reflected beams were recorded using the quadrant photodiode (QPD) on the IO table and the RF alignment detectors on the Interferometer Sensing and Control table (see Fig. 3). There are no lenses between the MC waist and its measurement QPD, so only the path length between the two were needed to calibrate in radians the pitch and yaw signals on the QPD. The interferometer reflected beam, however, passes through several lenses. Thus, ray transfer matrices and the two alignment detectors were necessary to determine the Faraday drift calibration. Figure 8 shows the calibrated beam steering data. The angle of the beam out of the MC does not change measurably as a function of input power in yaw (4.7 nrad/W) and changes by only 440 nrad/W in pitch. For the FI, we record a beam drift originating at the center of the Faraday rotator of 1.8 μrad/W in yaw and 3.2 μrad/W in pitch. Therefore, when ramping the input power up to 30 W during a full interferometer lock, the 5000 5500 6000 6500 7000 7500 8000 −300 −200 −100 0 100 200 300 time [sec] angle [urad] 5000 5500 6000 6500 7000 7500 8000 0 5 10 15 20 25 30 input power [ W] FI pitch FI yaw MC pitch (x10) MC yaw (x10) input power 0 10 20 30 40 50 60 −50 0 50 100 150 200 power in MC and FI [W] angle [urad] FI pitch FI yaw MC pitch MC yaw FIG. 8. Mode cleaner and Faraday isolator thermal drift data. (a) Angular motion of the beam at the MC waist and FI rotator as the input power is stepped. The beam is double-passed through the Faraday isolator, so it experiences twice the input power. (b) Average beam angle per power level in the MC and FI. Linear fits to the data are also shown. The slopes for MC yaw, MC pitch, FI yaw, and FI pitch, respectively, are 0.0047, 0.44, 1.8, and 3.2 μrad/W. upper limit on the drift experienced by the reflected beam is about 100 μrad. This is a 30-fold reduction with respect to the initial LIGO FI and represents a fifth of the beam’s divergence angle, θ div = 490 μrad. D. Thermal lensing We measured the profiles of both the beam transmitted through the mode cleaner and the reflected beam picked off by the FI at low (∼1 W) and high (∼25 W) input powers to assess the degree of thermal lensing induced in the MC and FI. Again, we misaligned the interferometer arms so that the input beam would be promptly reflected off the recycling mirror. We picked off a fraction of the reflected beam on the Interferometer Sensing and Control table and of the mode cleaner transmitted beam on the IO table (refer to Fig. 3), placed lenses in each of their paths, and measured the beam diameters at several locations on either side of the waists created by the lenses. A change in the beam waist size or position as a function of laser power indicates the presence of a thermal lens. As seen in Figs. 9 and 10, the waists of the two sets of data are collocated: no thermal lens is measured. For the FI, the divergence of the low and high power beams differs, indicating that the beam quality degrades with power. The M2 factor at 1 W is 1.04 indicating the beam is nearly perfectly a TEM00 mode. At 25 W, M2 increases to 1.19, corresponding Reuse of AIP Publishing content is subject to the terms at: https://publishing.aip.org/authors/rights-and-permissions. Download to IP: 183.195.251.6 On: Fri, 22 Apr 2016 00:54:10