正在加载图片...
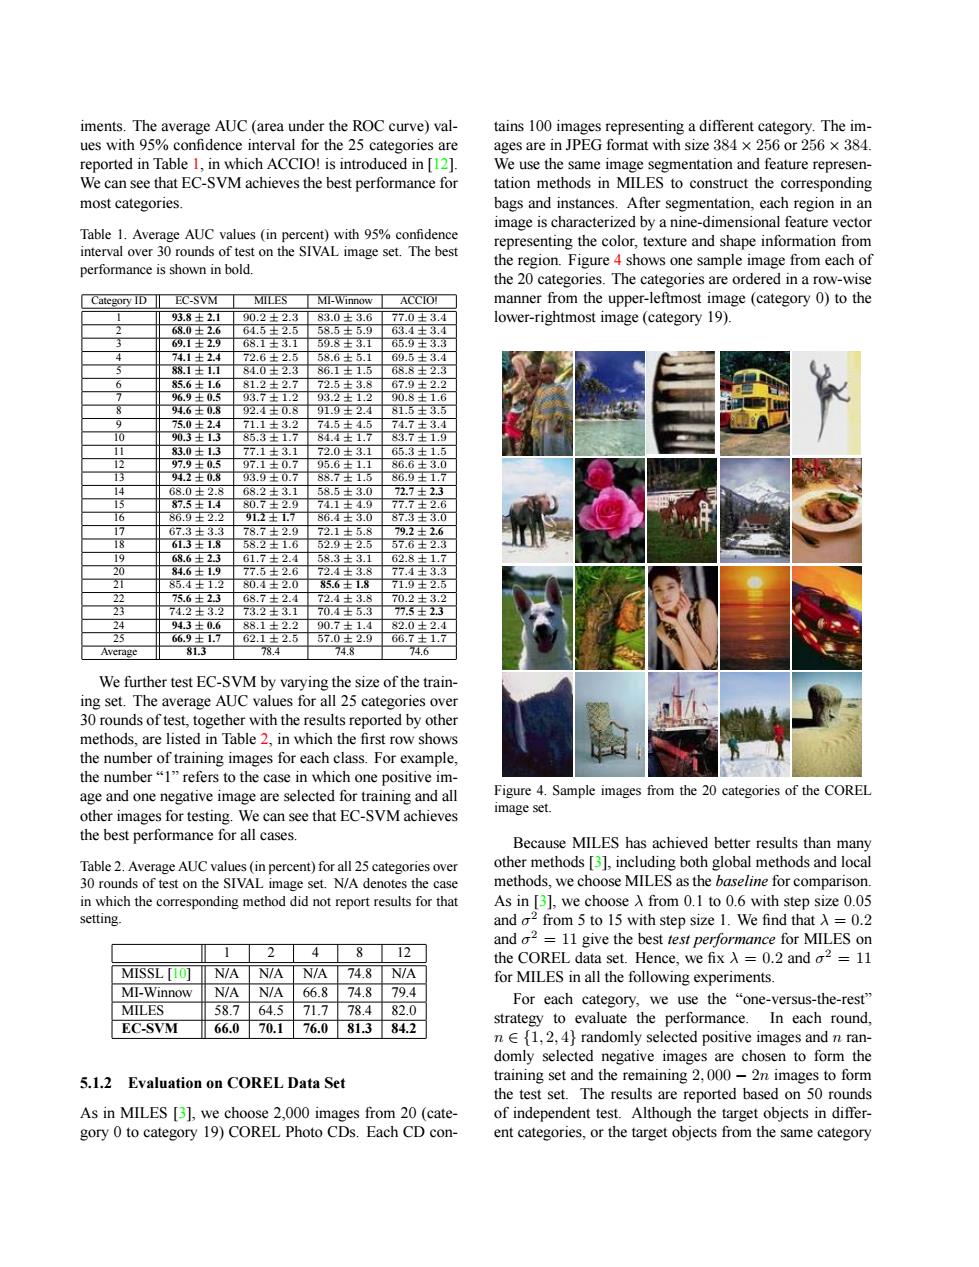
iments.The average AUC (area under the ROC curve)val- tains 100 images representing a different category.The im- ues with 95%confidence interval for the 25 categories are ages are in JPEG format with size 384 x 256 or 256 x 384. reported in Table 1,in which ACCIO!is introduced in [12]. We use the same image segmentation and feature represen- We can see that EC-SVM achieves the best performance for tation methods in MILES to construct the corresponding most categories. bags and instances.After segmentation,each region in an image is characterized by a nine-dimensional feature vector Table 1.Average AUC values (in percent)with 95%confidence interval over 30 rounds of test on the SIVAL image set.The best representing the color,texture and shape information from performance is shown in bold. the region.Figure 4 shows one sample image from each of the 20 categories.The categories are ordered in a row-wise Category ID EC-SVM MILES MI-Winnow ACCIO manner from the upper-leftmost image (category 0)to the 93.8±2.190.2±2.3 83.0±3.677.0±3.4 lower-rightmost image(category 19). 2 68.0±2.6 64.5士2.5 58.5±5.9 63.4±3.4 3 69.1士29 68.1±3.1 59.8±3.1 65.9士3.3 4 74.1±2.4 72.6±2.5 58.6±5.1 69.5±3.4 88.1士11 84.0士2.3 86.1士1.5 68.8士2.3 6 85.6±1.6 81.2士2.7 72.5±3.8 67.9士2.2 7 96.9士0.5 937士12932士12 90.8士1.6 8 94.6士0.8 g2.4士0.8 91.9士2.4 81.5王3.5 0 75.0±2.4 7113.2 745+45 74734 10 90.3士13 85.31.7 84.4士1.7 83.71.9 83.0士13 77.1±3.1 72.0±3.1 65.3±1.5 12 97.9土0.5 97.1士0.7 95.6±1.1 86.6士5.0 13 94.2士08 93.9士0.7 88.7士1.5 86.9士1.7 14 68.0±2.8 68.2±3.1 58.5±3.0 72.7±23 87.5士1.4 80.7±2.9 74.1士4.9 77.7士2.6 16 86.9±2.2 91.2士1.77 86.4士3.0 873士35.0 17 67.3±3.3 78.7士2.9 72.1±5.8 79.2±2.6 18 613士18 58.216 52.9士2.5 57.6士2.3 19 68.6±23 61.7±2.4 58.3±3.1 62.8±1.7 20 84.6士1.9 77.5士2.6 72.4±3.8 77.4士3.3 21 85.41.2 80.4士2.0 85.61.8 71.9士2.5 22 75.6±23 68.7±2.4 72438 70.2士3.2 23 74.2士3.2 73.2士3.1 70.4±5.3 77.5士2.3 24 94.3±0.6 88.1±2.2 90.7±1.4 82.0±2.4 25 66.9士1.7 62.1士2.5 570士2.9 66.7士1.7 Average 813 784 74.8 746 We further test EC-SVM by varying the size of the train- ing set.The average AUC values for all 25 categories over 30 rounds of test,together with the results reported by other methods,are listed in Table 2,in which the first row shows the number of training images for each class.For example, the number"1"refers to the case in which one positive im- age and one negative image are selected for training and all Figure 4.Sample images from the 20 categories of the COREL other images for testing.We can see that EC-SVM achieves image set. the best performance for all cases. Because MILES has achieved better results than many Table 2.Average AUC values(in percent)for all 25 categories over other methods [3],including both global methods and local 30 rounds of test on the SIVAL image set.N/A denotes the case methods.we choose MILES as the baseline for comparison. in which the corresponding method did not report results for that As in [3],we choose A from 0.1 to 0.6 with step size 0.05 setting. and o2 from 5 to 15 with step size 1.We find that A =0.2 and o2=11 give the best test performance for MILES on 2 4 812 the COREL data set.Hence,we fix A=0.2 and o2 11 MISSL[IO可 N/A N/A N/A 74.8 N/A for MILES in all the following experiments. MI-Winnow N/AN/A66.874.879.4 For each category,we use the "one-versus-the-rest" MILES 58.764.571.778.482.0 strategy to evaluate the performance.In each round. EC-SVM 66.070.176.081.384.2 n E{1,2,4}randomly selected positive images and n ran- domly selected negative images are chosen to form the 5.1.2 Evaluation on COREL Data Set training set and the remaining 2,000-2n images to form the test set.The results are reported based on 50 rounds As in MILES [3],we choose 2,000 images from 20(cate- of independent test.Although the target objects in differ- gory 0 to category 19)COREL Photo CDs.Each CD con- ent categories,or the target objects from the same categoryiments. The average AUC (area under the ROC curve) values with 95% confidence interval for the 25 categories are reported in Table 1, in which ACCIO! is introduced in [12]. We can see that EC-SVM achieves the best performance for most categories. Table 1. Average AUC values (in percent) with 95% confidence interval over 30 rounds of test on the SIVAL image set. The best performance is shown in bold. Category ID EC-SVM MILES MI-Winnow ACCIO! 1 93.8 ± 2.1 90.2 ± 2.3 83.0 ± 3.6 77.0 ± 3.4 2 68.0 ± 2.6 64.5 ± 2.5 58.5 ± 5.9 63.4 ± 3.4 3 69.1 ± 2.9 68.1 ± 3.1 59.8 ± 3.1 65.9 ± 3.3 4 74.1 ± 2.4 72.6 ± 2.5 58.6 ± 5.1 69.5 ± 3.4 5 88.1 ± 1.1 84.0 ± 2.3 86.1 ± 1.5 68.8 ± 2.3 6 85.6 ± 1.6 81.2 ± 2.7 72.5 ± 3.8 67.9 ± 2.2 7 96.9 ± 0.5 93.7 ± 1.2 93.2 ± 1.2 90.8 ± 1.6 8 94.6 ± 0.8 92.4 ± 0.8 91.9 ± 2.4 81.5 ± 3.5 9 75.0 ± 2.4 71.1 ± 3.2 74.5 ± 4.5 74.7 ± 3.4 10 90.3 ± 1.3 85.3 ± 1.7 84.4 ± 1.7 83.7 ± 1.9 11 83.0 ± 1.3 77.1 ± 3.1 72.0 ± 3.1 65.3 ± 1.5 12 97.9 ± 0.5 97.1 ± 0.7 95.6 ± 1.1 86.6 ± 3.0 13 94.2 ± 0.8 93.9 ± 0.7 88.7 ± 1.5 86.9 ± 1.7 14 68.0 ± 2.8 68.2 ± 3.1 58.5 ± 3.0 72.7 ± 2.3 15 87.5 ± 1.4 80.7 ± 2.9 74.1 ± 4.9 77.7 ± 2.6 16 86.9 ± 2.2 91.2 ± 1.7 86.4 ± 3.0 87.3 ± 3.0 17 67.3 ± 3.3 78.7 ± 2.9 72.1 ± 5.8 79.2 ± 2.6 18 61.3 ± 1.8 58.2 ± 1.6 52.9 ± 2.5 57.6 ± 2.3 19 68.6 ± 2.3 61.7 ± 2.4 58.3 ± 3.1 62.8 ± 1.7 20 84.6 ± 1.9 77.5 ± 2.6 72.4 ± 3.8 77.4 ± 3.3 21 85.4 ± 1.2 80.4 ± 2.0 85.6 ± 1.8 71.9 ± 2.5 22 75.6 ± 2.3 68.7 ± 2.4 72.4 ± 3.8 70.2 ± 3.2 23 74.2 ± 3.2 73.2 ± 3.1 70.4 ± 5.3 77.5 ± 2.3 24 94.3 ± 0.6 88.1 ± 2.2 90.7 ± 1.4 82.0 ± 2.4 25 66.9 ± 1.7 62.1 ± 2.5 57.0 ± 2.9 66.7 ± 1.7 Average 81.3 78.4 74.8 74.6 We further test EC-SVM by varying the size of the training set. The average AUC values for all 25 categories over 30 rounds of test, together with the results reported by other methods, are listed in Table 2, in which the first row shows the number of training images for each class. For example, the number “1” refers to the case in which one positive image and one negative image are selected for training and all other images for testing. We can see that EC-SVM achieves the best performance for all cases. Table 2. Average AUC values (in percent) for all 25 categories over 30 rounds of test on the SIVAL image set. N/A denotes the case in which the corresponding method did not report results for that setting. 1 2 4 8 12 MISSL [10] N/A N/A N/A 74.8 N/A MI-Winnow N/A N/A 66.8 74.8 79.4 MILES 58.7 64.5 71.7 78.4 82.0 EC-SVM 66.0 70.1 76.0 81.3 84.2 5.1.2 Evaluation on COREL Data Set As in MILES [3], we choose 2,000 images from 20 (category 0 to category 19) COREL Photo CDs. Each CD contains 100 images representing a different category. The images are in JPEG format with size 384 × 256 or 256 × 384. We use the same image segmentation and feature representation methods in MILES to construct the corresponding bags and instances. After segmentation, each region in an image is characterized by a nine-dimensional feature vector representing the color, texture and shape information from the region. Figure 4 shows one sample image from each of the 20 categories. The categories are ordered in a row-wise manner from the upper-leftmost image (category 0) to the lower-rightmost image (category 19). Figure 4. Sample images from the 20 categories of the COREL image set. Because MILES has achieved better results than many other methods [3], including both global methods and local methods, we choose MILES as the baseline for comparison. As in [3], we choose λ from 0.1 to 0.6 with step size 0.05 and σ 2 from 5 to 15 with step size 1. We find that λ = 0.2 and σ 2 = 11 give the best test performance for MILES on the COREL data set. Hence, we fix λ = 0.2 and σ 2 = 11 for MILES in all the following experiments. For each category, we use the “one-versus-the-rest” strategy to evaluate the performance. In each round, n ∈ {1, 2, 4} randomly selected positive images and n randomly selected negative images are chosen to form the training set and the remaining 2, 000 − 2n images to form the test set. The results are reported based on 50 rounds of independent test. Although the target objects in different categories, or the target objects from the same category