正在加载图片...
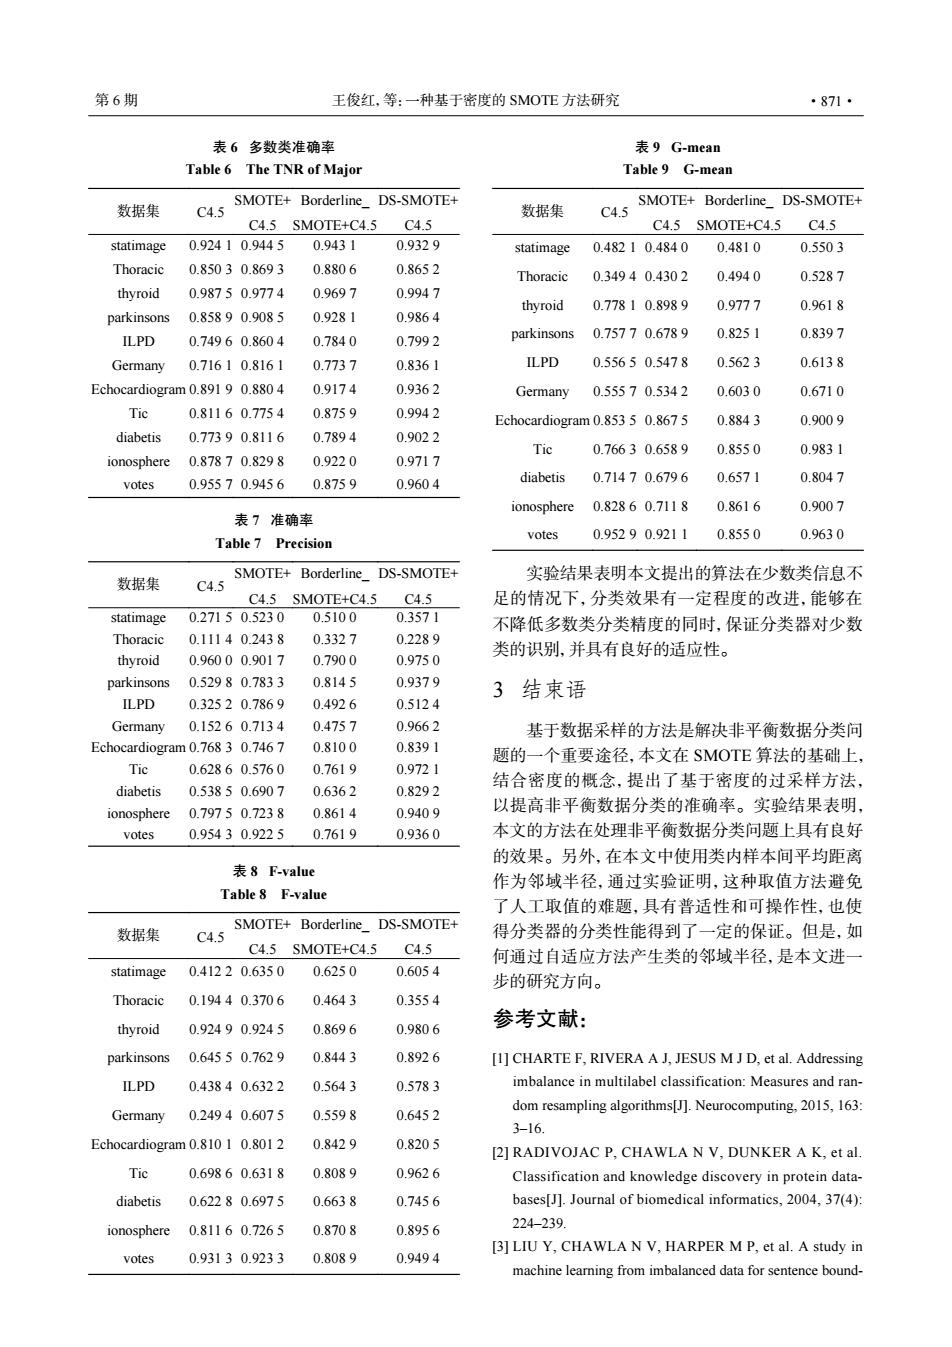
第6期 王俊红,等:一种基于密度的SMOTE方法研究 ·871· 表6多数类准确率 表9G-mean Table 6 The TNR of Major Table 9 G-mean SMOTE+Borderline DS-SMOTE+ SMOTE+ 数据集 Borderline DS-SMOTE+ 数据集 C4.5 C4.5 C4.5 SMOTE+C4.5 C4.5 C4.5 SMOTE+C4.5 C4.5 statimage 0.92410.9445 0.9431 0.9329 statimage 0.48210.4840 0.4810 0.5503 Thoracic 0.85030.8693 0.8806 0.8652 Thoracic 0.34940.4302 0.4940 0.5287 thyroid 0.98750.9774 0.9697 0.9947 thyroid 0.77810.8989 0.9777 0.9618 parkinsons 0.85890.9085 0.9281 0.9864 ILPD 0.74960.8604 0.7840 0.7992 parkinsons 0.75770.6789 0.8251 0.8397 Germany 0.71610.8161 0.7737 0.8361 ILPD 0.55650.5478 0.5623 0.6138 Echocardiogram 0.891 9 0.880 4 0.9174 0.9362 Germany 0.55570.5342 0.6030 0.6710 Tic 0.81160.7754 0.8759 0.9942 Echocardiogram 0.853 5 0.867 5 0.8843 0.9009 diabetis 0.77390.8116 0.7894 0.9022 Tic 0.76630.6589 0.8550 0.9831 ionosphere 0.87870.8298 0.9220 0.9717 votes 0.95570.9456 0.8759 0.9604 diabetis 0.71470.6796 0.6571 0.8047 ionosphere 0.82860.7118 0.8616 0.9007 表7准确率 Table 7 Precision votes 0.95290.9211 0.8550 0.9630 数据集 SMOTE+Borderline_DS-SMOTE+ 实验结果表明本文提出的算法在少数类信息不 C4.5 C4.5 SMOTE+C4.5 C4.5 足的情况下,分类效果有一定程度的改进,能够在 statimage 0.27150.5230 0.5100 0.3571 不降低多数类分类精度的同时,保证分类器对少数 Thoracic 0.11140.2438 0.3327 0.2289 类的识别,并具有良好的适应性。 thyroid 0.96000.9017 0.7900 0.9750 parkinsons 0.52980.7833 0.8145 0.9379 3结束语 ILPD 0.32520.7869 0.4926 0.5124 Germany 0.15260.7134 0.4757 0.9662 基于数据采样的方法是解决非平衡数据分类问 Echocardiogram 0.768 3 0.746 7 0.8100 0.8391 题的一个重要途径,本文在SMOTE算法的基础上, Tic 0.62860.5760 0.7619 0.9721 diabetis 0.53850.6907 0.6362 0.8292 结合密度的概念,提出了基于密度的过采样方法, ionosphere 0.797 5 0.723 8 0.8614 0.9409 以提高非平衡数据分类的准确率。实验结果表明, votes 0.95430.9225 0.7619 0.9360 本文的方法在处理非平衡数据分类问题上具有良好 的效果。另外,在本文中使用类内样本间平均距离 表8F-value 作为邻域半径,通过实验证明,这种取值方法避免 Table 8 F-value 了人工取值的难题,具有普适性和可操作性,也使 SMOTE+Borderline DS-SMOTE+ 数据集 C4.5 得分类器的分类性能得到了一定的保证。但是,如 C4.5 SMOTE+C4.5 C4.5 何通过自适应方法产生类的邻域半径,是本文进一 statimage 0.41220.6350 0.6250 0.6054 步的研究方向。 Thoracic 0.19440.3706 0.4643 0.3554 参考文献: thyroid 0.92490.9245 0.8696 0.9806 parkinsons 0.64550.7629 0.8443 0.8926 [1]CHARTE F,RIVERA A J,JESUS M J D,et al.Addressing ILPD 0.43840.6322 0.5643 0.5783 imbalance in multilabel classification:Measures and ran- Germany 0.24940.6075 0.5598 0.6452 dom resampling algorithms[J].Neurocomputing,2015,163: 3-16. Echocardiogram 0.810 1 0.801 2 0.8429 0.8205 [2]RADIVOJAC P,CHAWLA N V,DUNKER A K,et al. Tic 0.69860.6318 0.8089 0.9626 Classification and knowledge discovery in protein data- diabetis 0.62280.6975 0.6638 0.7456 bases[J].Journal of biomedical informatics,2004,37(4): ionosphere 0.811 6 0.726 5 0.8708 0.8956 224-239. [3]LIU Y,CHAWLA N V,HARPER M P,et al.A study in votes 0.93130.9233 0.8089 0.9494 machine learning from imbalanced data for sentence bound-实验结果表明本文提出的算法在少数类信息不 足的情况下,分类效果有一定程度的改进,能够在 不降低多数类分类精度的同时,保证分类器对少数 类的识别,并具有良好的适应性。 3 结束语 基于数据采样的方法是解决非平衡数据分类问 题的一个重要途径,本文在 SMOTE 算法的基础上, 结合密度的概念,提出了基于密度的过采样方法, 以提高非平衡数据分类的准确率。实验结果表明, 本文的方法在处理非平衡数据分类问题上具有良好 的效果。另外,在本文中使用类内样本间平均距离 作为邻域半径,通过实验证明,这种取值方法避免 了人工取值的难题,具有普适性和可操作性,也使 得分类器的分类性能得到了一定的保证。但是,如 何通过自适应方法产生类的邻域半径,是本文进一 步的研究方向。 参考文献: CHARTE F, RIVERA A J, JESUS M J D, et al. Addressing imbalance in multilabel classification: Measures and random resampling algorithms[J]. Neurocomputing, 2015, 163: 3–16. [1] RADIVOJAC P, CHAWLA N V, DUNKER A K, et al. Classification and knowledge discovery in protein databases[J]. Journal of biomedical informatics, 2004, 37(4): 224–239. [2] LIU Y, CHAWLA N V, HARPER M P, et al. A study in machine learning from imbalanced data for sentence bound- [3] 表 6 多数类准确率 Table 6 The TNR of Major 数据集 C4.5 SMOTE+ C4.5 Borderline_ SMOTE+C4.5 DS-SMOTE+ C4.5 statimage 0.924 1 0.944 5 0.943 1 0.932 9 Thoracic 0.850 3 0.869 3 0.880 6 0.865 2 thyroid 0.987 5 0.977 4 0.969 7 0.994 7 parkinsons 0.858 9 0.908 5 0.928 1 0.986 4 ILPD 0.749 6 0.860 4 0.784 0 0.799 2 Germany 0.716 1 0.816 1 0.773 7 0.836 1 Echocardiogram 0.891 9 0.880 4 0.917 4 0.936 2 Tic 0.811 6 0.775 4 0.875 9 0.994 2 diabetis 0.773 9 0.811 6 0.789 4 0.902 2 ionosphere 0.878 7 0.829 8 0.922 0 0.971 7 votes 0.955 7 0.945 6 0.875 9 0.960 4 表 7 准确率 Table 7 Precision 数据集 C4.5 SMOTE+ C4.5 Borderline_ SMOTE+C4.5 DS-SMOTE+ C4.5 statimage 0.271 5 0.523 0 0.510 0 0.357 1 Thoracic 0.111 4 0.243 8 0.332 7 0.228 9 thyroid 0.960 0 0.901 7 0.790 0 0.975 0 parkinsons 0.529 8 0.783 3 0.814 5 0.937 9 ILPD 0.325 2 0.786 9 0.492 6 0.512 4 Germany 0.152 6 0.713 4 0.475 7 0.966 2 Echocardiogram 0.768 3 0.746 7 0.810 0 0.839 1 Tic 0.628 6 0.576 0 0.761 9 0.972 1 diabetis 0.538 5 0.690 7 0.636 2 0.829 2 ionosphere 0.797 5 0.723 8 0.861 4 0.940 9 votes 0.954 3 0.922 5 0.761 9 0.936 0 表 8 F-value Table 8 F-value 数据集 C4.5 SMOTE+ C4.5 Borderline_ SMOTE+C4.5 DS-SMOTE+ C4.5 statimage 0.412 2 0.635 0 0.625 0 0.605 4 Thoracic 0.194 4 0.370 6 0.464 3 0.355 4 thyroid 0.924 9 0.924 5 0.869 6 0.980 6 parkinsons 0.645 5 0.762 9 0.844 3 0.892 6 ILPD 0.438 4 0.632 2 0.564 3 0.578 3 Germany 0.249 4 0.607 5 0.559 8 0.645 2 Echocardiogram 0.810 1 0.801 2 0.842 9 0.820 5 Tic 0.698 6 0.631 8 0.808 9 0.962 6 diabetis 0.622 8 0.697 5 0.663 8 0.745 6 ionosphere 0.811 6 0.726 5 0.870 8 0.895 6 votes 0.931 3 0.923 3 0.808 9 0.949 4 表 9 G-mean Table 9 G-mean 数据集 C4.5 SMOTE+ C4.5 Borderline_ SMOTE+C4.5 DS-SMOTE+ C4.5 statimage 0.482 1 0.484 0 0.481 0 0.550 3 Thoracic 0.349 4 0.430 2 0.494 0 0.528 7 thyroid 0.778 1 0.898 9 0.977 7 0.961 8 parkinsons 0.757 7 0.678 9 0.825 1 0.839 7 ILPD 0.556 5 0.547 8 0.562 3 0.613 8 Germany 0.555 7 0.534 2 0.603 0 0.671 0 Echocardiogram 0.853 5 0.867 5 0.884 3 0.900 9 Tic 0.766 3 0.658 9 0.855 0 0.983 1 diabetis 0.714 7 0.679 6 0.657 1 0.804 7 ionosphere 0.828 6 0.711 8 0.861 6 0.900 7 votes 0.952 9 0.921 1 0.855 0 0.963 0 第 6 期 王俊红,等:一种基于密度的 SMOTE 方法研究 ·871·