正在加载图片...

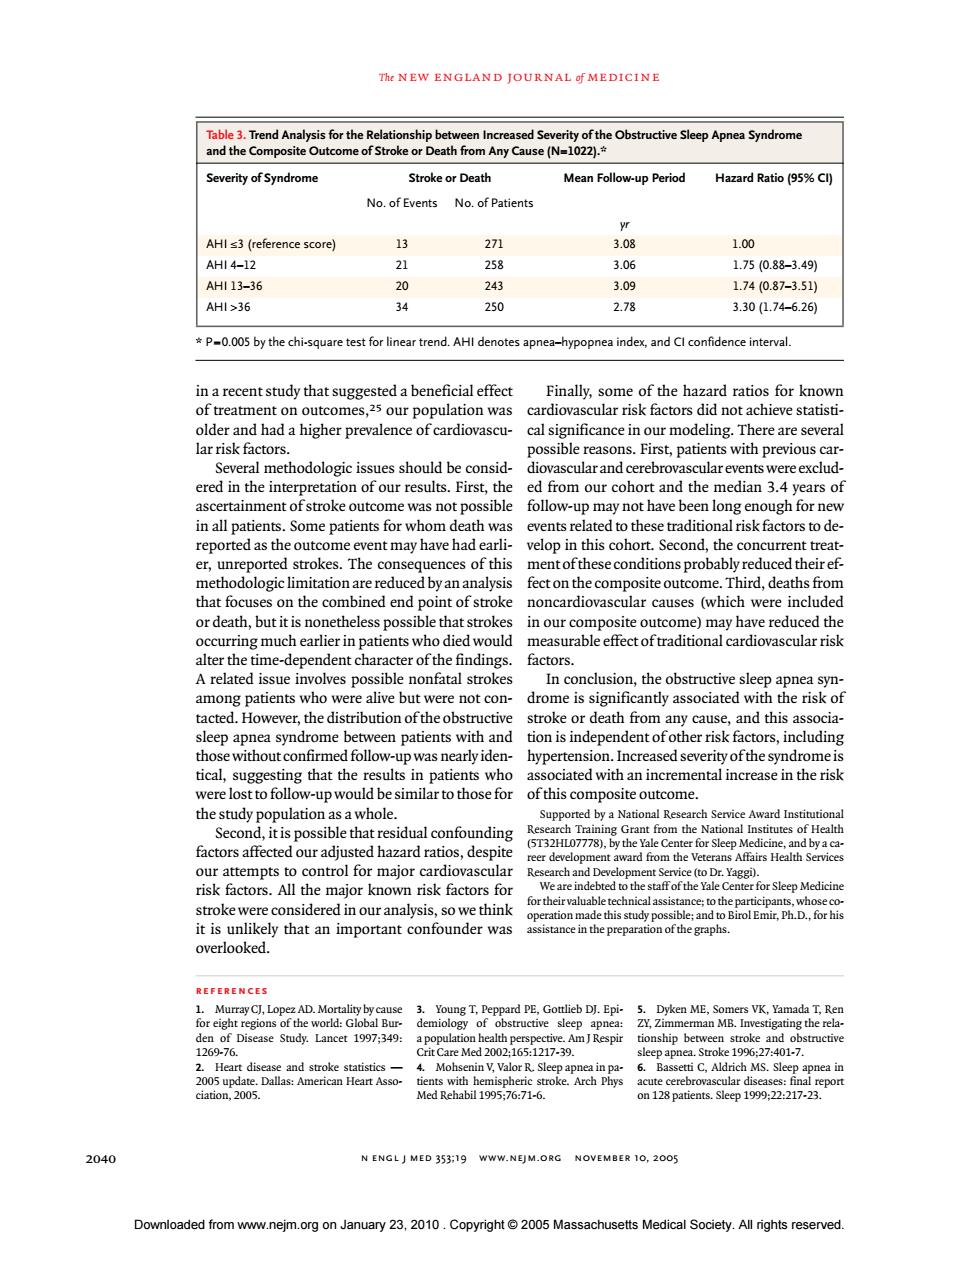
Th NEW ENGLAND IOURNAL FMEDICINE and the (N e Sleep Apnea Syndrome rity ofSyndrome Stroke or Death Mean Follow-up Period Hazard Ratio (95%Cl No.of Events No.of Patients HI s3 (reference score) 13 271 258 1.750.8-3.49 AH13-3 174(0.87-3.5 AHI>36 250 2.78 3.30(1.74-6.26 P005 by the chisquare test for linear trend.AHI denotes apnea-ypopnea indexand Clconfidence interval. t study that cardiova older and had a higher prevalence of cardiovascu-cal significance in our modeling.There are several es should be ad fo nd th dian ex ssible follow-up may not have been long enough for new in all patients.Some patients for whom death was events related to these traditional risk factors to de reported as the out me e event may have had ea velop in this coho e concurrent trea ite Third.deat that focuses on the combined end point of stroke noncardiovascular causes (which were included or death,but it is nonetheless possible that strokes in our composite outcome)may have reduced the occurring much earli in patients who measurable effect of traditional cardiovascular risk A related issue involves possible nonfatal strokes In conelusion the abstructive slee among patients who were alive but were not con- donesSgniheaniy9OaseoeaewmeskOe tacted.However,the distribution of the obstr apnea syndrom een patents wit ion is indep ent o ors,includi tical suggesting that the results in patients who associated with an incremental increase in the risk were lost to follow-up would be similar to those for of this composite outcome. the study confou Health our attempts to control for major cardiovascular rch and De risk factors.All the major known risk factors for it is REFERENCES y.Lncct1997:34 are Mo epo o 1 paticnts Slep 19992217- 2040 N ENGLJ MED 353:19 WWW.NEJM.ORG NOVEMBER 10,2005 Downloaded from www.neim.org on January 23.2010.Copyright 2005 Massachusetts Medical Society.All rights reserved.n engl j med 353;19 www.nejm.org november 10, 2005 The new england journal of medicine 2040 in a recent study that suggested a beneficial effect of treatment on outcomes,25 our population was older and had a higher prevalence of cardiovascular risk factors. Several methodologic issues should be considered in the interpretation of our results. First, the ascertainment of stroke outcome was not possible in all patients. Some patients for whom death was reported as the outcome event may have had earlier, unreported strokes. The consequences of this methodologic limitation are reduced by an analysis that focuses on the combined end point of stroke or death, but it is nonetheless possible that strokes occurring much earlier in patients who died would alter the time-dependent character of the findings. A related issue involves possible nonfatal strokes among patients who were alive but were not contacted. However, the distribution of the obstructive sleep apnea syndrome between patients with and those without confirmed follow-up was nearly identical, suggesting that the results in patients who were lost to follow-up would be similar to those for the study population as a whole. Second, it is possible that residual confounding factors affected our adjusted hazard ratios, despite our attempts to control for major cardiovascular risk factors. All the major known risk factors for stroke were considered in our analysis, so we think it is unlikely that an important confounder was overlooked. Finally, some of the hazard ratios for known cardiovascular risk factors did not achieve statistical significance in our modeling. There are several possible reasons. First, patients with previous cardiovascular and cerebrovascular events were excluded from our cohort and the median 3.4 years of follow-up may not have been long enough for new events related to these traditional risk factors to develop in this cohort. Second, the concurrent treatment of these conditions probably reduced their effect on the composite outcome. Third, deaths from noncardiovascular causes (which were included in our composite outcome) may have reduced the measurable effect of traditional cardiovascular risk factors. In conclusion, the obstructive sleep apnea syndrome is significantly associated with the risk of stroke or death from any cause, and this association is independent of other risk factors, including hypertension. Increased severity of the syndrome is associated with an incremental increase in the risk of this composite outcome. Supported by a National Research Service Award Institutional Research Training Grant from the National Institutes of Health (5T32HL07778), by the Yale Center for Sleep Medicine, and by a career development award from the Veterans Affairs Health Services Research and Development Service (to Dr. Yaggi). We are indebted to the staff of the Yale Center for Sleep Medicine for their valuable technical assistance; to the participants, whose cooperation made this study possible; and to Birol Emir, Ph.D., for his assistance in the preparation of the graphs. references 1. Murray CJ, Lopez AD. Mortality by cause for eight regions of the world: Global Burden of Disease Study. Lancet 1997;349: 1269-76. 2. Heart disease and stroke statistics — 2005 update. Dallas: American Heart Association, 2005. 3. Young T, Peppard PE, Gottlieb DJ. Epidemiology of obstructive sleep apnea: a population health perspective. Am J Respir Crit Care Med 2002;165:1217-39. 4. Mohsenin V, Valor R. Sleep apnea in patients with hemispheric stroke. Arch Phys Med Rehabil 1995;76:71-6. 5. Dyken ME, Somers VK, Yamada T, Ren ZY, Zimmerman MB. Investigating the relationship between stroke and obstructive sleep apnea. Stroke 1996;27:401-7. 6. Bassetti C, Aldrich MS. Sleep apnea in acute cerebrovascular diseases: final report on 128 patients. Sleep 1999;22:217-23. * P=0.005 by the chi-square test for linear trend. AHI denotes apnea–hypopnea index, and CI confidence interval. Table 3. Trend Analysis for the Relationship between Increased Severity of the Obstructive Sleep Apnea Syndrome and the Composite Outcome of Stroke or Death from Any Cause (N=1022).* Severity of Syndrome Stroke or Death Mean Follow-up Period Hazard Ratio (95% CI) No. of Events No. of Patients yr AHI ≤3 (reference score) 13 271 3.08 1.00 AHI 4–12 21 258 3.06 1.75 (0.88–3.49) AHI 13–36 20 243 3.09 1.74 (0.87–3.51) AHI >36 34 250 2.78 3.30 (1.74–6.26) Downloaded from www.nejm.org on January 23, 2010 . Copyright © 2005 Massachusetts Medical Society. All rights reserved