正在加载图片...
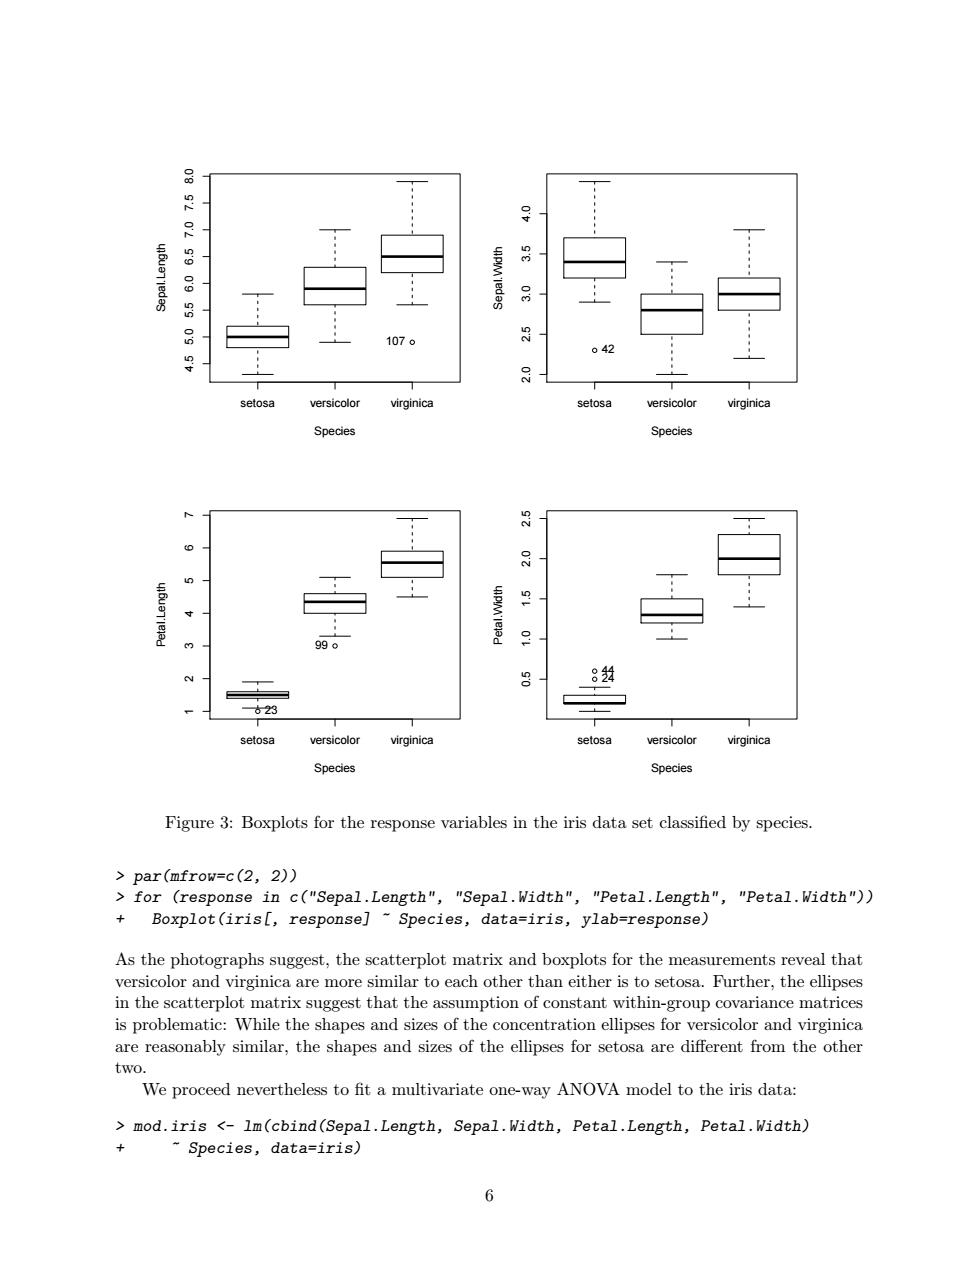
2. 0'9 107。 3 042 setosa versicolor virginica setosa versicolor virginica Species Species 日 6 PIM'leed 990 8牡 古23 setosa versicolor virginica setosa versicolor virginica Species Species Figure 3:Boxplots for the response variables in the iris data set classified by species. par(mfrow=c(2,2)) for (response in c("Sepal.Length","Sepal.Width","Petal.Length","Petal.Width")) + Boxplot(iris[,response]~Species,data=iris,ylab=response) As the photographs suggest,the scatterplot matrix and boxplots for the measurements reveal that versicolor and virginica are more similar to each other than either is to setosa.Further,the ellipses in the scatterplot matrix suggest that the assumption of constant within-group covariance matrices is problematic:While the shapes and sizes of the concentration ellipses for versicolor and virginica are reasonably similar,the shapes and sizes of the ellipses for setosa are different from the other two. We proceed nevertheless to fit a multivariate one-way ANOVA model to the iris data: mod.iris <-lm(cbind(Sepal.Length,Sepal.Width,Petal.Length,Petal.Width) ~Species,data=iris) 6● setosa versicolor virginica 4.5 5.0 5.5 6.0 6.5 7.0 7.5 8.0 Species Sepal.Length 107 ● setosa versicolor virginica 2.0 2.5 3.0 3.5 4.0 Species Sepal.Width 42 ● ● setosa versicolor virginica 1 2 3 4 5 6 7 Species Petal.Length 23 99 ● ● setosa versicolor virginica 0.5 1.0 1.5 2.0 2.5 Species Petal.Width 2444 Figure 3: Boxplots for the response variables in the iris data set classified by species. > par(mfrow=c(2, 2)) > for (response in c("Sepal.Length", "Sepal.Width", "Petal.Length", "Petal.Width")) + Boxplot(iris[, response] ~ Species, data=iris, ylab=response) As the photographs suggest, the scatterplot matrix and boxplots for the measurements reveal that versicolor and virginica are more similar to each other than either is to setosa. Further, the ellipses in the scatterplot matrix suggest that the assumption of constant within-group covariance matrices is problematic: While the shapes and sizes of the concentration ellipses for versicolor and virginica are reasonably similar, the shapes and sizes of the ellipses for setosa are different from the other two. We proceed nevertheless to fit a multivariate one-way ANOVA model to the iris data: > mod.iris <- lm(cbind(Sepal.Length, Sepal.Width, Petal.Length, Petal.Width) + ~ Species, data=iris) 6