正在加载图片...
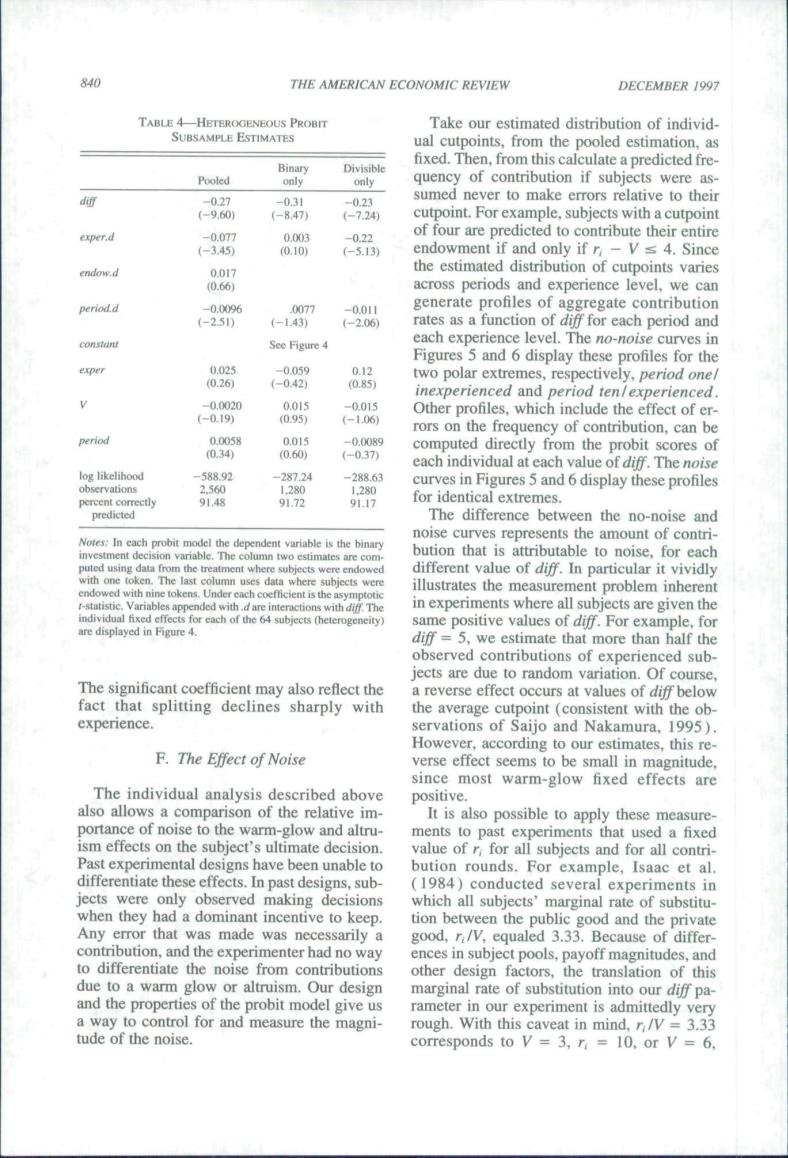
840 THE AMERICAN ECONOMIC REVIEW DECEMBER 1997 sumed never to make errors relative to their eper.d ontribute their entre the estimated distribution endow.c of cut nts across periods and experience level,we can -7 generate profiles of aggregate contribution es as a function ofd ffor each period and curves in two polar extre 85 8 ontrib ion.can b each individual at each value of The og curves in Figures 5 and6 display these profiles identical extremes nts the the o-moiseand pution that is to noise.for rent value of diff.In particular it vividly app dif=5.we estimate that more than half the observed contributions of experienced sub. The significant coefficient may also reflect the ation.Of fact that splitting declines sharply with the average cut oint (cons experience. servations of Saijo and Nakamura.1995) F.The Effect of Noise Howeve erse most are The individual analysis described above positive. It is also possible to apply these measure on a fixed Past experimental designs have been unable to rounds differentiate these effectsIn past designs,sub (1984)conducted several experiments in aking which all subjects'marginal rate of substitu Any error that was made arily other and the pr war ties of the rate of substitut ion into our diff pa- away for and measure the magn tude of the noise. corresponds to V=3.r 10.or V=6.840 THE AMERICAN ECONOMIC REVIEW DECEMBER 1997 TABLE 4—HETEROGENEOUS PROBIT SUBSAMPLE ESTIMATES diff exper.d endow.d period.d constant exper V period log likelihood observations percent correctly predicted Pooled -0.27 (-9,60) -0.077 (-3.45) 0.017 (0.66) -0.0096 (-2,5!) 0,025 (0,26) -0.0020 (-0.19) 0.0058 (0,34) -588,92 2.560 91,48 Binary only -0,31 (-8,47) 0,003 (0,10) .0077 (-1.43) See Figure 4 -0,059 (-0.42) 0,015 (0,95) 0,015 (0,60) -287.24 1,280 91.72 Divisible only -0.23 (-7.24) -0.22 (-5.13) -0,011 (-2,06) 0.12 (0.85) -0,015 (-1-06) -0,0089 (-0,37) -288.63 1,280 91,17 Notes: In each probit model ihe dependeni variable is the binary investmem decision variable. The column two estimates are computed using data frotn the treatment where subjects were endowed with one token. The last column uses data where subjects were endowed with nine tokens. Under each coefficient is the asymptotic r-statistic. Variables appended with .dare interactions with diff. The individual fixed effects for each of the 64 subjects (heterogeneity) are displayed in Figure 4. The significant coefficient may also reflect the fact that splitting declines sharply with experience. F. The Effect of Noise The individual analysis described above also allows a comparison of the relative importance of noise to the warm-glow and altruism effects on the subject's ultimate decision. Past experimental designs have been unable to differentiate these effects. In past designs, subjects were only observed making decisions when they had a dominant incentive to keep. Any error that was made was necessarily a contribution, and the experimenter had no way to differentiate the noise from contributions due to a warm glow or altruism. Our design and the properties of the probit model give us a way to control for and measure the magnitude of the noise. Take our estimated distribution of individual cutpoints, from the pooled estimation, as fixed. Then, from this calculate a predicted frequency of contribution if subjects were assumed never to make errors relative to their cutpoint. For example, subjects with a cutpoint of four are predicted to contribute their entire endowment if and only if r, - V :e 4. Since the estimated distribution of cutpoints varies across periods and experience level, we can generate profiles of aggregate contribution rates as a function of diff for each period and each experience level. The no-noise curves in Figures 5 and 6 display these profiles for the two polar extremes, respectively, period one! inexperienced and period ten!experienced. Other profiles, which include the effect of errors on the frequency of contribution, can be computed directly from the probit scores of each individual at each value of diff. The noise curves in Figures 5 and 6 display these profiles for identical extremes. The difference between the no-noise and noise curves represents the amount of contribution that is attributable to noise, for each different value of diff. In particular it vividly illustrates the measurement problem inherent in experiments where all subjects are given the same positive values of diff. For example, for diff = 5, we estimate that more than half the observed contributions of experienced subjects are due to random variation. Of course, a reverse effect occurs at values of diff below the average cutpoint (consistent with the observations of Saijo and Nakamura, 1995). However, according to our estimates, this reverse effect seems to be small in magnitude, since most warm-glow fixed effects are positive. It is also possible to apply these measurements to past experiments that used a fixed value of ri for al! subjects and for all contribution rounds. For example, Isaac et al, (1984) conducted several experiments in which all subjects' marginal rate of substitution between the public good and the private good, r,/V, equaled 3.33. Because of differences in subject pools, payoff magnitudes, and other design factors, the translation of this marginal rate of substitution into our diff parameter in our experiment is admittedly very rough. With this caveat in mind, r,/V = 3.33 corresponds to K = 3, r, = 10, or V = 6