正在加载图片...
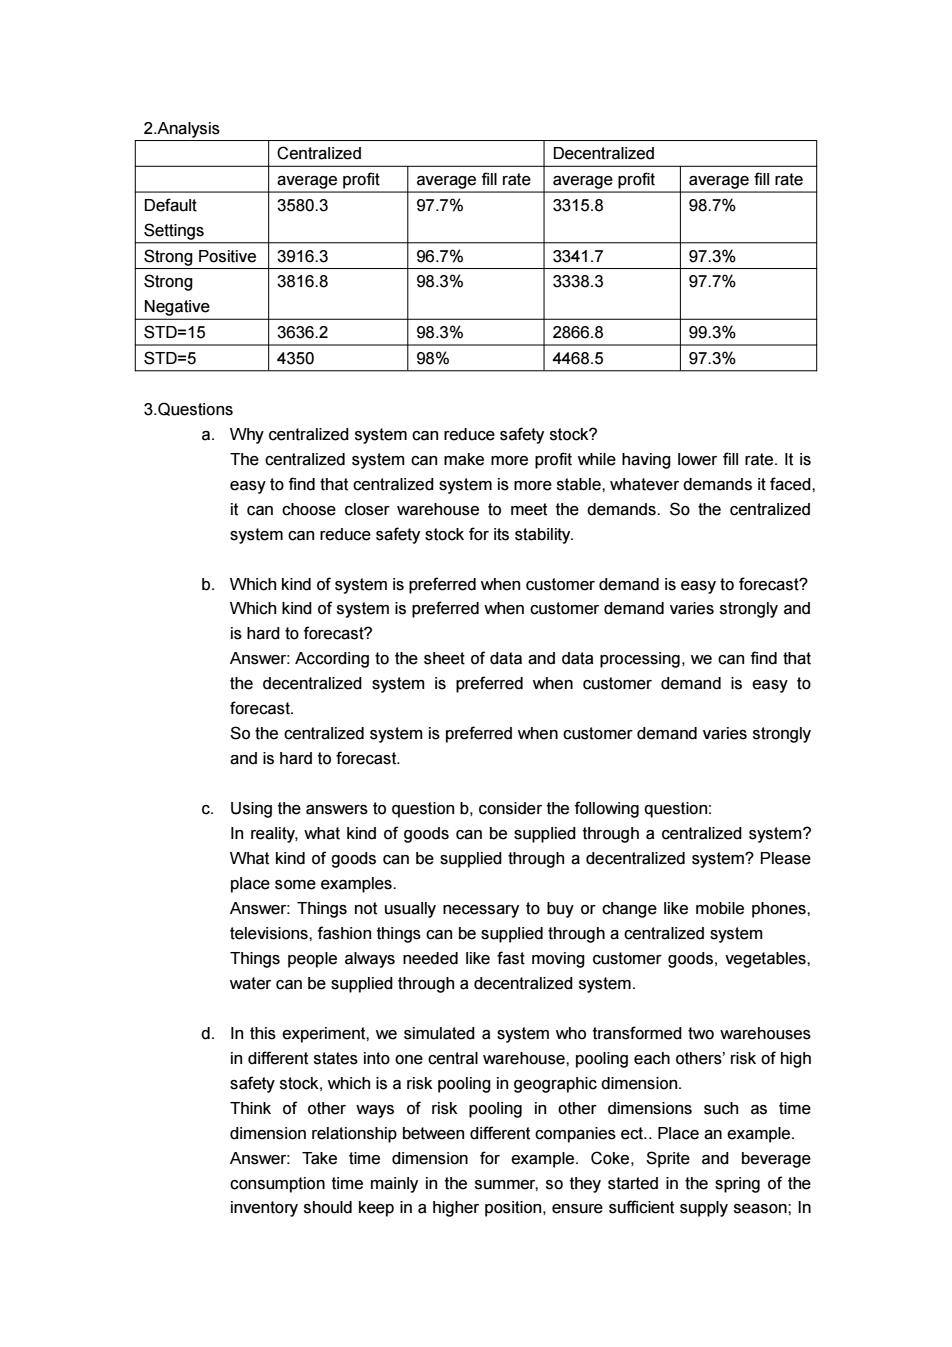
2.Analysis Centralized Decentralized average profit average fill rate average profit average fill rate Default 3580.3 97.7% 3315.8 98.7% Settings Strong Positive 3916.3 96.7% 3341.7 97.3% Strong 3816.8 98.3% 3338.3 97.7% Negative STD=15 3636.2 98.3% 2866.8 99.3% STD=5 4350 98% 4468.5 97.3% 3.Questions a.Why centralized system can reduce safety stock? The centralized system can make more profit while having lower fill rate.It is easy to find that centralized system is more stable,whatever demands it faced. it can choose closer warehouse to meet the demands.So the centralized system can reduce safety stock for its stability. b.Which kind of system is preferred when customer demand is easy to forecast? Which kind of system is preferred when customer demand varies strongly and is hard to forecast? Answer:According to the sheet of data and data processing,we can find that the decentralized system is preferred when customer demand is easy to forecast. So the centralized system is preferred when customer demand varies strongly and is hard to forecast. c.Using the answers to question b,consider the following question: In reality,what kind of goods can be supplied through a centralized system? What kind of goods can be supplied through a decentralized system?Please place some examples. Answer:Things not usually necessary to buy or change like mobile phones, televisions,fashion things can be supplied through a centralized system Things people always needed like fast moving customer goods,vegetables, water can be supplied through a decentralized system. d.In this experiment,we simulated a system who transformed two warehouses in different states into one central warehouse,pooling each others'risk of high safety stock,which is a risk pooling in geographic dimension. Think of other ways of risk pooling in other dimensions such as time dimension relationship between different companies ect..Place an example. Answer:Take time dimension for example.Coke,Sprite and beverage consumption time mainly in the summer,so they started in the spring of the inventory should keep in a higher position,ensure sufficient supply season;In2.Analysis Centralized Decentralized average profit average fill rate average profit average fill rate Default Settings 3580.3 97.7% 3315.8 98.7% Strong Positive 3916.3 96.7% 3341.7 97.3% Strong Negative 3816.8 98.3% 3338.3 97.7% STD=15 3636.2 98.3% 2866.8 99.3% STD=5 4350 98% 4468.5 97.3% 3.Questions a. Why centralized system can reduce safety stock? The centralized system can make more profit while having lower fill rate. It is easy to find that centralized system is more stable, whatever demands it faced, it can choose closer warehouse to meet the demands. So the centralized system can reduce safety stock for its stability. b. Which kind of system is preferred when customer demand is easy to forecast? Which kind of system is preferred when customer demand varies strongly and is hard to forecast? Answer: According to the sheet of data and data processing, we can find that the decentralized system is preferred when customer demand is easy to forecast. So the centralized system is preferred when customer demand varies strongly and is hard to forecast. c. Using the answers to question b, consider the following question: In reality, what kind of goods can be supplied through a centralized system? What kind of goods can be supplied through a decentralized system? Please place some examples. Answer: Things not usually necessary to buy or change like mobile phones, televisions, fashion things can be supplied through a centralized system Things people always needed like fast moving customer goods, vegetables, water can be supplied through a decentralized system. d. In this experiment, we simulated a system who transformed two warehouses in different states into one central warehouse, pooling each others’ risk of high safety stock, which is a risk pooling in geographic dimension. Think of other ways of risk pooling in other dimensions such as time dimension relationship between different companies ect.. Place an example. Answer: Take time dimension for example. Coke, Sprite and beverage consumption time mainly in the summer, so they started in the spring of the inventory should keep in a higher position, ensure sufficient supply season; In