正在加载图片...
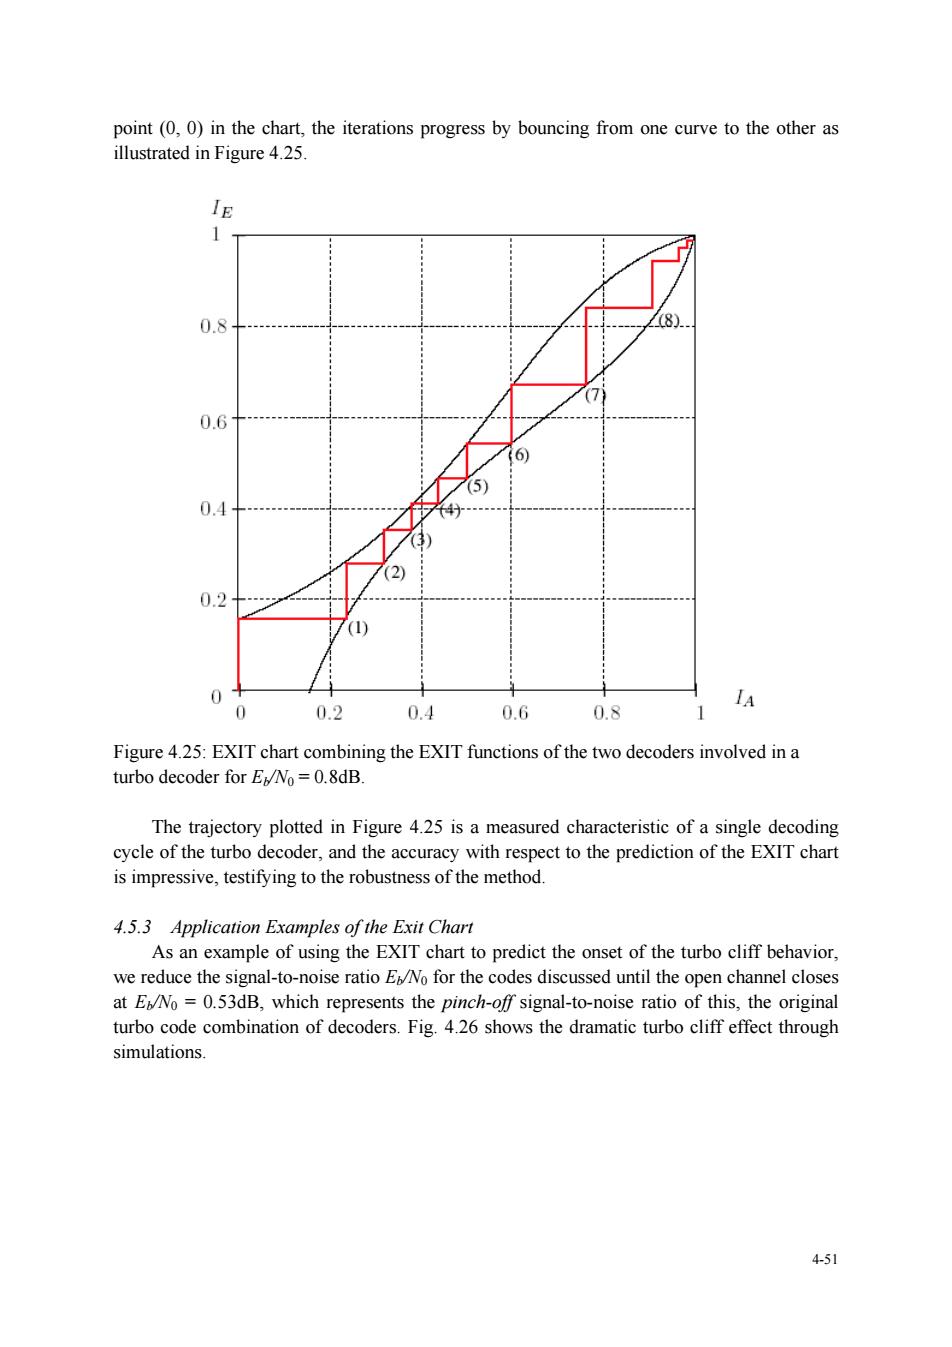
point(0,0)in the chart,the iterations progress by bouncing from one curve to the other as illustrated in Figure 4.25. 0.8 8 0.6 0.4 0 IA 02 0.4 0.6 08 Figure 4.25:EXIT chart combining the EXIT functions of the two decoders involved in a turbo decoder for ENo=0.8dB The trajectory plotted in Figure 4.25 is a measured characteristic of a single decoding cycle of the 1。 and the accurac with resp ct to the prediction of the EXITchar is impressive,testifying to the robustness of the method 4.5.3 Application Examples of the Exit Chart As an example of using the EXIT chart to predict the onset of the turbo cliff behavior, annel closes turbo code combination of decoders.Fig.4.26 shows the dramatic turbo cliff effect through simulations. 451 4-51 point (0, 0) in the chart, the iterations progress by bouncing from one curve to the other as illustrated in Figure 4.25. Figure 4.25: EXIT chart combining the EXIT functions of the two decoders involved in a turbo decoder for Eb/N0 = 0.8dB. The trajectory plotted in Figure 4.25 is a measured characteristic of a single decoding cycle of the turbo decoder, and the accuracy with respect to the prediction of the EXIT chart is impressive, testifying to the robustness of the method. 4.5.3 Application Examples of the Exit Chart As an example of using the EXIT chart to predict the onset of the turbo cliff behavior, we reduce the signal-to-noise ratio Eb/N0 for the codes discussed until the open channel closes at Eb/N0 = 0.53dB, which represents the pinch-off signal-to-noise ratio of this, the original turbo code combination of decoders. Fig. 4.26 shows the dramatic turbo cliff effect through simulations