正在加载图片...
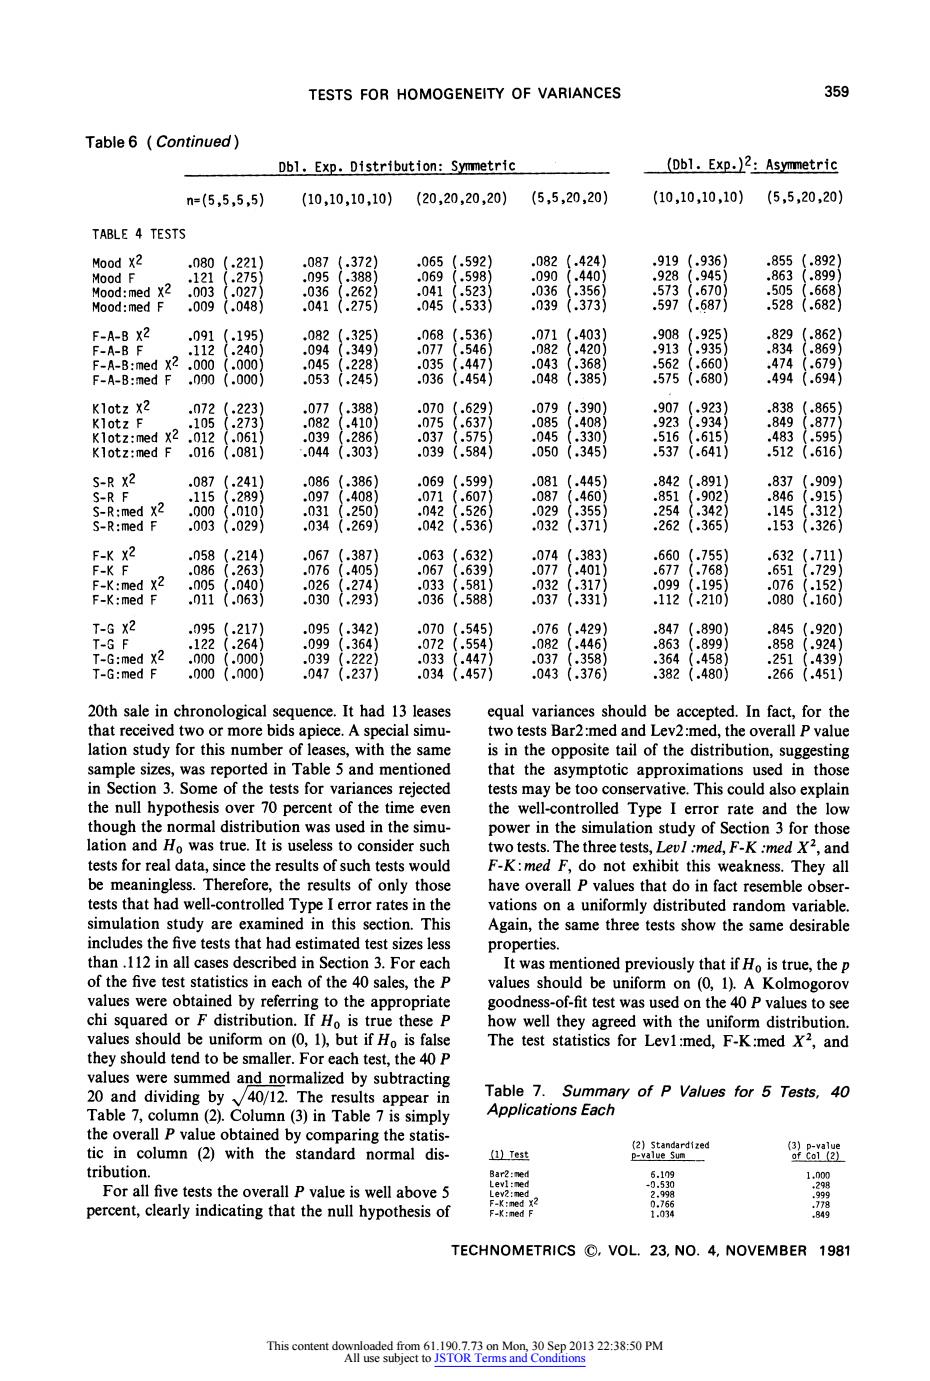
TESTS FOR HOMOGENEITY OF VARIANCES 359 Table6(Continued) Dbl.Exp.Distribution:Symmetric (Db1.Exp.)2:Asymmetric n=(5,5,5,5) (10,10,10,10) (20,20,20,20)】 (5,5,20,20) (10,10,10,10) (5,5,20,20) TABLE 4 TESTS Mood x2 .080 ,221 .087 .372 .065 .592) .082 .424 ,919 (.936) .855 (.892) Mood F 2 .275 .095 .388 .069 .598 .090 .440 .928 .945 .863 (.899 Mood:med x2 .003 .027 ,036 ,262 .041 .523 .036 .356 73 .670 .505 .66R Mood:med F .009 (.048 .041 .275 .045 .533 .039 .373) 59 .687 .528 (.682) F-A-B X2 .091 .195 082 .325 .068 .536 .071 .403 .908 .925 .829 .862 F-A-B F .112 .240 .094 .349 .077 .546 .082 .420 .913 ,935 .834 (.869 F-A-B:med X2 .000 (.000 .045 .228 .035 .447 .043 .368) .562 .660 .474 (.679 F-A-B:med F ,000 .000 .053 .245 .036 (.454 .048 .385 .575 (.680 .494 .694 Klotz x2 .072 (,223 .077 .388 .070 .629 .079 .390 .907 ,923 .838 .865 Klotz F .105 .273 .082 .410 ,075 ,637 085 .408) 923 .934 849 877 Klotz:med x2 .012 (.061 .039 .286 .037 .575 .045 .330 .516 .615 .483 (.595) Klotz:med F .016 (.081) .044 .303 .039 (.584i .050 (.345) ,537 .641 .512 .616 S-R X2 .087 .241 .086 ,386 .069 ,599 .081 .445 .842 .891 .837 .909 S-R F ,115 .289 .097 .408 .071 .607 .087 (.460 .851 .902 .846 .915 S-R:med x2 .000 (.010 .031 .250 .042 .526 .029 (.355 .254 .342 .145 (.312 S-R:med F .003 (.029 .034 .269 .042 .536) .032 .371 .262 .365 .153 .326 F-K X2 .058 .214 067 .387 .063 .632 .074 383 .660 755 .632 .711 F-K F .086 .263 .076 .405 .067 .639 ,077 .401 .677 .768 .651 .729 F-K:med x2 .005 .040 .026 .274 .033 .581 .032 ,317 .099 ,195 .076 .152 F-K:med F .011 .063 .030 .293 .036 .588 .037 .331) .112 20 .080 .160) T-G X2 .095 27 .095 .342 .070 .545 .076 (,429 847 ,890) 845 .920 T-GF .122 .264 .099 .364 .072 .554 .082 .446) .863 .899 .858 .924 T-G:med X2 .000 .000 .039 222 ,033 447 .037 .358) .364 .458 .251 .439 T-G:med F .000(.000) .047 .2371 .034 .457 .043 .376) .382 .480 .266 (.451 20th sale in chronological sequence.It had 13 leases equal variances should be accepted.In fact,for the that received two or more bids apiece.A special simu- two tests Bar2:med and Lev2:med,the overall P value lation study for this number of leases,with the same is in the opposite tail of the distribution,suggesting sample sizes,was reported in Table 5 and mentioned that the asymptotic approximations used in those in Section 3.Some of the tests for variances rejected tests may be too conservative.This could also explain the null hypothesis over 70 percent of the time even the well-controlled Type I error rate and the low though the normal distribution was used in the simu- power in the simulation study of Section 3 for those lation and Ho was true.It is useless to consider such two tests.The three tests,Levl:med,F-K :med X2,and tests for real data,since the results of such tests would F-K:med F,do not exhibit this weakness.They all be meaningless.Therefore,the results of only those have overall P values that do in fact resemble obser- tests that had well-controlled Type I error rates in the vations on a uniformly distributed random variable simulation study are examined in this section.This Again,the same three tests show the same desirable includes the five tests that had estimated test sizes less properties. than.112 in all cases described in Section 3.For each It was mentioned previously that if Ho is true,the p of the five test statistics in each of the 40 sales,the P values should be uniform on (0,1).A Kolmogorov values were obtained by referring to the appropriate goodness-of-fit test was used on the 40 P values to see chi squared or F distribution.If Ho is true these P how well they agreed with the uniform distribution. values should be uniform on(0,1),but if Ho is false The test statistics for Levl:med,F-K:med X2,and they should tend to be smaller.For each test,the 40 P values were summed and normalized by subtracting 20 and dividing by 40/12.The results appear in Table 7. Summary of P Values for 5 Tests,40 Table 7,column(2).Column(3)in Table 7 is simply Applications Each the overall P value obtained by comparing the statis- tic in column(2)with the standard normal dis- (2)Standardized p-value Sum 9tel tribution. Bar2:med 6.109 1.000 For all five tests the overall P value is well above 5 398 F-K:med x2 0.766 percent,clearly indicating that the null hypothesis of F-K:med F 1.034 TECHNOMETRICS©,VOL.23,NO.4.NOVEMBER1981 This content downloaded from 61.190.7.73 on Mon,30 Sep 2013 22:38:50 PM All use subject to JSTOR Terms and ConditionsTESTS FOR HOMOGENEITY OF VARIANCES Table 6 (Continued) Dbl. Exp. Distribution: Symmetric (Dbl. Exp.)2: Asymmetric n=(5,5,5,5) (10,10,10,10) (20,20,20,20) (5,5,20,20) (10,10,10,10) TABLE 4 TESTS Mood X2 Mood F Mood:med Mood:med X2 F F-A-B X2 F-A-B F F-A-B:med X2 F-A-B:med F Klotz X2 Klotz F Klotz:med X2 Klotz:med F S-R X2 S-R F S-R:med S-R:med F-K X2 F-K F F-K:med F-K:med T-G X2 T-G F T-G:med T-G:med X2 F X2 F X2 F .080 (.221) .121 (.275) .003 (.027) .009 (.048) .091 (.195) .112 (.240) .000 (.000) .000 (.000) .072 (.223) .105 (.273) .012 (.061) .016 (.081) .087 (.241) .115 (.289) .000 (.010) .003 (.029) .058 (.214) .086 (.263) .005 (.040) .011 (.063) .095 (.217) .122 (.264) .000 (.000) .000ooo (.000) .919 (.936) .928 (.945) .573 (.670) .597 (.687) 20th sale in chronological sequence. It had 13 leases that received two or more bids apiece. A special simulation study for this number of leases, with the same sample sizes, was reported in Table 5 and mentioned in Section 3. Some of the tests for variances rejected the null hypothesis over 70 percent of the time even though the normal distribution was used in the simulation and Ho was true. It is useless to consider such tests for real data, since the results of such tests would be meaningless. Therefore, the results of only those tests that had well-controlled Type I error rates in the simulation study are examined in this section. This includes the five tests that had estimated test sizes less than .112 in all cases described in Section 3. For each of the five test statistics in each of the 40 sales, the P values were obtained by referring to the appropriate chi squared or F distribution. If Ho is true these P values should be uniform on (0, 1), but if Ho is false they should tend to be smaller. For each test, the 40 P values were summed and normalized by subtracting 20 and dividing by ,/40/12. The results appear in Table 7, column (2). Column (3) in Table 7 is simply the overall P value obtained by comparing the statistic in column (2) with the standard normal distribution. For all five tests the overall P value is well above 5 percent, clearly indicating that the null hypothesis of equal variances should be accepted. In fact, for the two tests Bar2 :med and Lev2 :med, the overall P value is in the opposite tail of the distribution, suggesting that the asymptotic approximations used in those tests may be too conservative. This could also explain the well-controlled Type I error rate and the low power in the simulation study of Section 3 for those two tests. The three tests, Levl :med, F-K :med X2, and F-K: med F, do not exhibit this weakness. They all have overall P values that do in fact resemble observations on a uniformly distributed random variable. Again, the same three tests show the same desirable properties. It was mentioned previously that if Ho is true, the p values should be uniform on (0, 1). A Kolmogorov goodness-of-fit test was used on the 40 P values to see how well they agreed with the uniform distribution. The test statistics for Levl :med, F-K:med X2, and Table 7. Summary of P Values for 5 Tests, 40 Applications Each (1) Test Bar2:med Levl :med Lev2:med F-K:med X2 F-K:med F (2) Standardized p-value Sum 6.109 -0.530 2.998 0.766 1.034 (3) p-value of Col (2) 1.000 .298 .999 .778 .849 TECHNOMETRICS ?, VOL. 23, NO. 4, NOVEMBER 1981 .065 .069 .041 .045 (5,5,20,20) (.592) (.598) (.523) (.533) .082 .090 .036 .039 (.424) (.440) (.356) (.373) .068 (.536) .077 (.546) .035 (.447) .036 (.454) .855 (.892) .863 (.899) .505 (.668) .528 (.682) .071 (.403) .082 (.420) .043 (.368) .048 (.385) .087 .095 .036 .041 .082 .094 .045 .053 .077 .082 .039 .044 .086 .097 .031 .034 .067 .076 .026 .030 .095 .099 .039 .047 (.372) (.388) (.262) (.275) (.325) (.349) (.228) (.245) (.388) (.410) (.286) (.303) (.386) (.408) (.250) (.269) (.387) (.405) (.274) (.293) (.342) (.364) (.222) (.237) .070 .075 .037 .039 .069 .071 .042 .042 .063 .067 .033 .036 .070 .072 .033 .034 (.629) (.637) (.575) (.584) (.599) (.607) (.526) (.536) (.632) (.639) (.581) (.588) (.545) (.554) (.447) (.457) .908 .913 .562 .575 .907 .923 .516 .537 .842 .851 .254 .262 .660 .677 .099 .112 .847 .863 .364 .382 .079 .085 .045 .050 .081 .087 .029 .032 .074 .077 .032 .037 .076 .082 .037 .043 (.925) (.935) (.660) (.680) (.923) (.934) (.615) (.641) (.891) (.902) (.342) (.365) (.755) (.768) (.195) (.210) (.890) (.899) (.458) (.480) (.390) (.408) (.330) (.345) (.445) (.460) (.355) (.371) (.383) (.401) (.317) (.331) (.429) (.446) (.358) (.376) .829 .834 .474 .494 .838 .849 .483 .512 .837 .846 .145 .153 .632 .651 .076 .080 .845 .858 .251 .266 (.862) (.869) (.679) (.694) (.865) (.877) (.595) (.616) (.909) (.915) (.312) (.326) (.711) (.729) (.152) (.160) (.920) (.924) (.439) (.451) 359 This content downloaded from 61.190.7.73 on Mon, 30 Sep 2013 22:38:50 PM All use subject to JSTOR Terms and Conditions