正在加载图片...
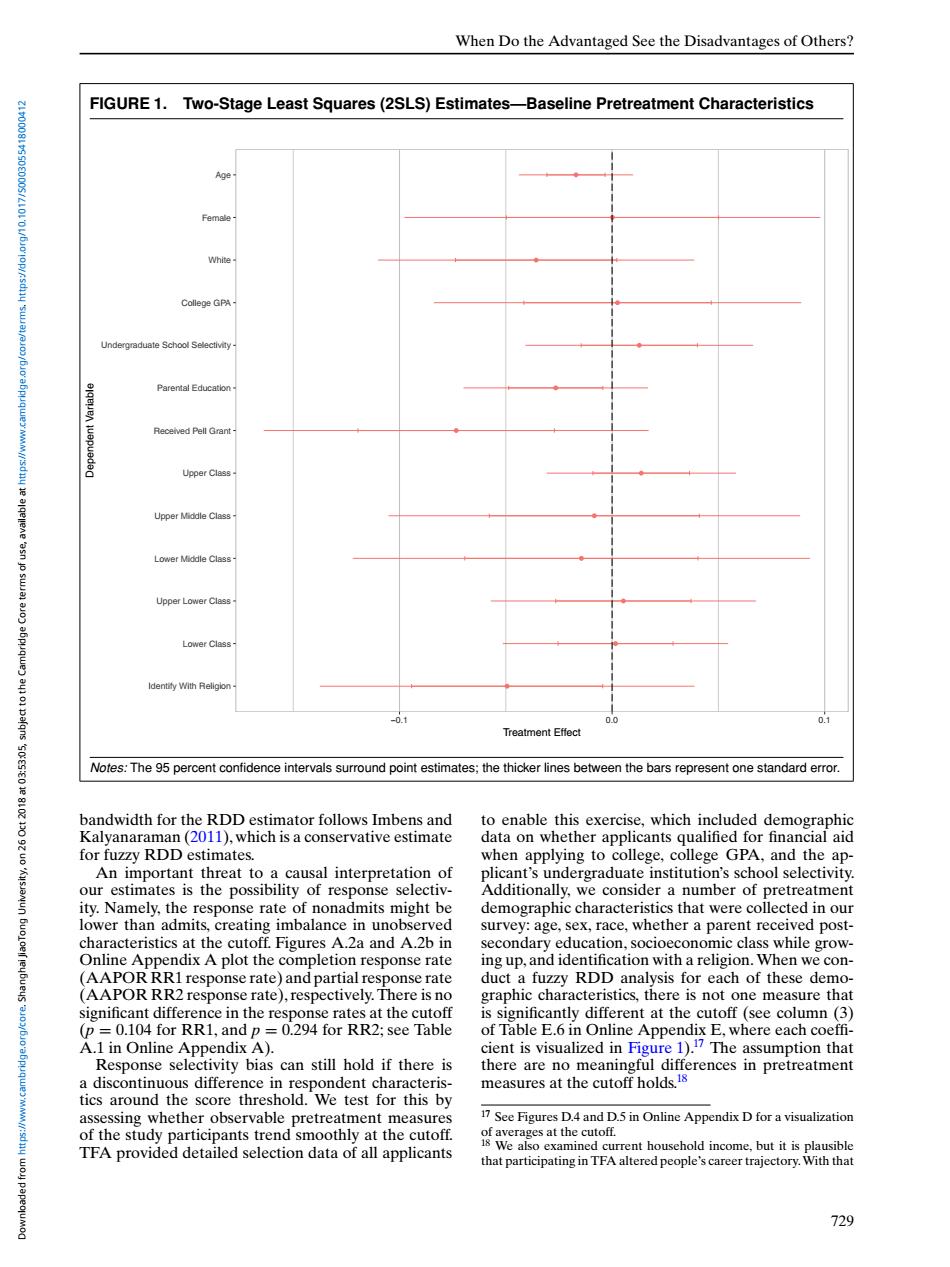
When Do the Advantaged See the Disadvantages of Others? FIGURE 1.Two-Stage Least Squares(2SLS)Estimates-Baseline Pretreatment Characteristics Age Female White Callege GPA Undergraduate School Selectivity Parental Education- Received Pell Grant Upper Class e asn Upper Middle Class Lower Middle Class- Upper Lower Class- Lower Class Identity With Religion 0.0 Treatment Effect Notes:The 95 percent confidence intervals surround point estimates;the thicker lines between the bars represent one standard error bandwidth for the RDD estimator follows Imbens and to enable this exercise,which included demographic Kalyanaraman(2011),which is a conservative estimate data on whether applicants qualified for financial aid for fuzzy RDD estimates. when applying to college,college GPA,and the ap- An important threat to a causal interpretation of plicant's undergraduate institution's school selectivity. our estimates is the possibility of response selectiv- Additionally,we consider a number of pretreatment ity.Namely,the response rate of nonadmits might be demographic characteristics that were collected in our lower than admits,creating imbalance in unobserved survey:age,sex,race,whether a parent received post- characteristics at the cutoff.Figures A.2a and A.2b in secondary education,socioeconomic class while grow- Online Appendix A plot the completion response rate ing up,and identification with a religion.When we con- (AAPOR RR1 response rate)and partial response rate duct a fuzzy RDD analysis for each of these demo- (AAPOR RR2 response rate),respectively.There is no graphic characteristics,there is not one measure that significant difference in the response rates at the cutoff is significantly different at the cutoff(see column (3) (p =0.104 for RR1,and p =0.294 for RR2;see Table of Table E.6 in Online Appendix E,where each coeffi- A.1 in Online Appendix A). cient is visualized in Figure 1).17 The assumption that Response selectivity bias can still hold if there is there are no meaningful differences in pretreatment a discontinuous difference in respondent characteris- measures at the cutoff holds.18 tics around the score threshold.We test for this by assessing whether observable pretreatment measures 17See Figures D.4 and D.5 in Online Appendix D for a visualization of the study participants trend smoothly at the cutoff. TFA provided detailed selection data of all applicants went houschold incom.but itspauibe that participating in TFA altered people's career trajectory.With that 729When Do the Advantaged See the Disadvantages of Others? FIGURE 1. Two-Stage Least Squares (2SLS) Estimates—Baseline Pretreatment Characteristics Identify With Religion Lower Class Upper Lower Class Lower Middle Class Upper Middle Class Upper Class Received Pell Grant Parental Education Undergraduate School Selectivity College GPA White Female Age −0.1 0.0 0.1 Treatment Effect Dependent Variable Notes: The 95 percent confidence intervals surround point estimates; the thicker lines between the bars represent one standard error. bandwidth for the RDD estimator follows Imbens and Kalyanaraman (2011), which is a conservative estimate for fuzzy RDD estimates. An important threat to a causal interpretation of our estimates is the possibility of response selectivity. Namely, the response rate of nonadmits might be lower than admits, creating imbalance in unobserved characteristics at the cutoff. Figures A.2a and A.2b in Online Appendix A plot the completion response rate (AAPOR RR1 response rate) and partial response rate (AAPOR RR2 response rate), respectively. There is no significant difference in the response rates at the cutoff (p = 0.104 for RR1, and p = 0.294 for RR2; see Table A.1 in Online Appendix A). Response selectivity bias can still hold if there is a discontinuous difference in respondent characteristics around the score threshold. We test for this by assessing whether observable pretreatment measures of the study participants trend smoothly at the cutoff. TFA provided detailed selection data of all applicants to enable this exercise, which included demographic data on whether applicants qualified for financial aid when applying to college, college GPA, and the applicant’s undergraduate institution’s school selectivity. Additionally, we consider a number of pretreatment demographic characteristics that were collected in our survey: age, sex, race, whether a parent received postsecondary education, socioeconomic class while growing up, and identification with a religion.When we conduct a fuzzy RDD analysis for each of these demographic characteristics, there is not one measure that is significantly different at the cutoff (see column (3) of Table E.6 in Online Appendix E, where each coefficient is visualized in Figure 1).17 The assumption that there are no meaningful differences in pretreatment measures at the cutoff holds.18 17 See Figures D.4 and D.5 in Online Appendix D for a visualization of averages at the cutoff. 18 We also examined current household income, but it is plausible that participating in TFA altered people’s career trajectory.With that 729 Downloaded from https://www.cambridge.org/core. Shanghai JiaoTong University, on 26 Oct 2018 at 03:53:05, subject to the Cambridge Core terms of use, available at https://www.cambridge.org/core/terms. https://doi.org/10.1017/S0003055418000412