正在加载图片...
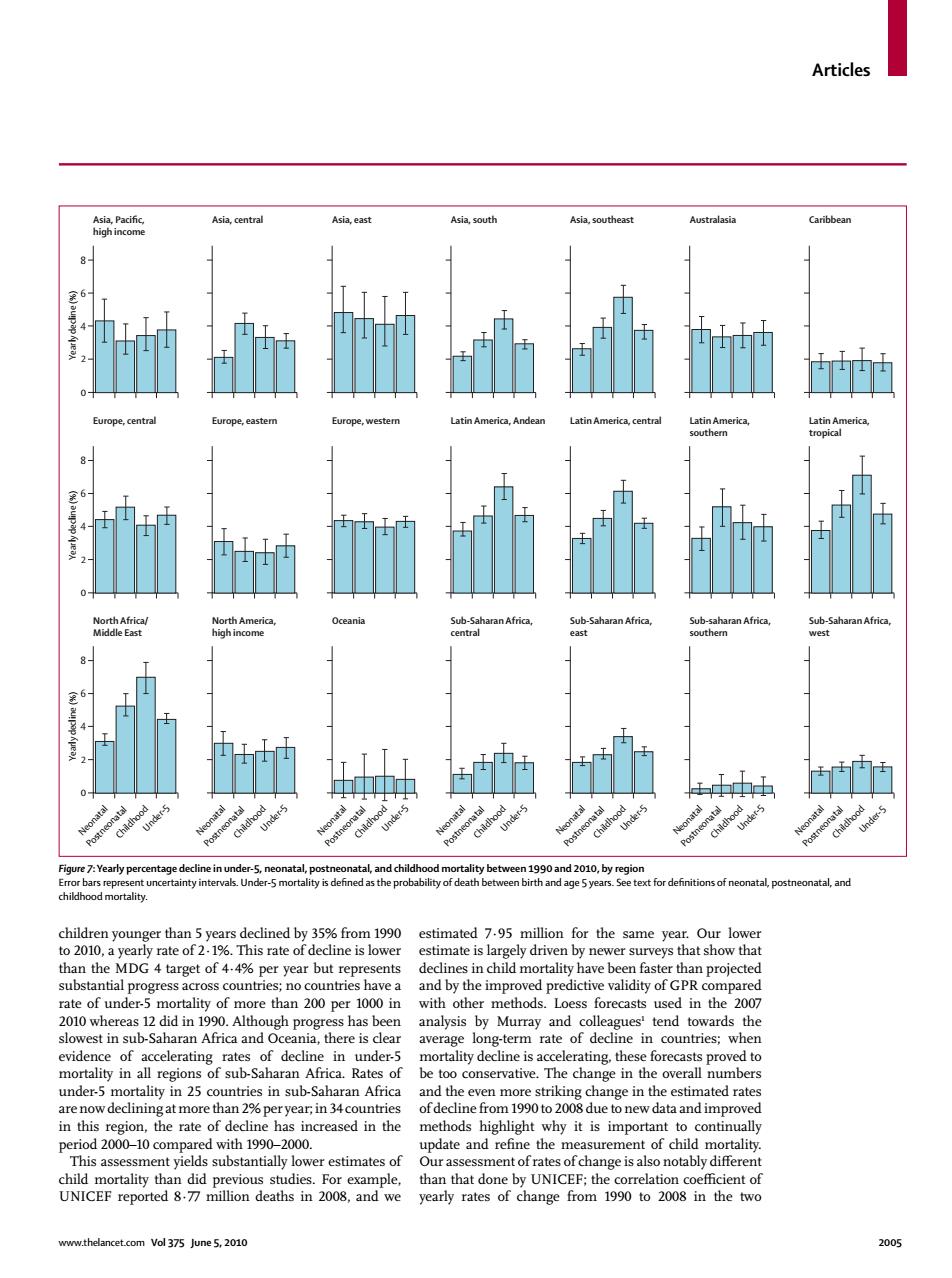
Articles Asia.Pacific Asia,central Asia,east Asia,south Asia,southeast Australasia Caribbean high income 8 6 4 Europe,central Europe,eastem Europe,western Latin America,Andean Latin America,central Latin America, Latin America, southern tropical 8- 6 North Africa/ North America Oceania Sub-Saharan Africa, Sub-Saharan Africa, Sub-saharan Africa Sub-Saharan Africa Middle East highincome central east southern west 6、 4 od 19 Post Ch Under-5 P Figure 7:Yearly percentage decline in under-5,neonatal,postneonatal,and childhood mortality between 1990 and 2010,by region Error bars represent uncertainty intervals.Under-5 mortality is defined as the probability of death between birth and age 5years.See text for definitions of neonatal,postneonatal,and childhood mortality. children younger than 5 years declined by 35%from 1990 estimated 7.95 million for the same year.Our lower to 2010,a yearly rate of 2.1%.This rate of decline is lower estimate is largely driven by newer surveys that show that than the MDG 4 target of 4.4%per year but represents declines in child mortality have been faster than projected substantial progress across countries;no countries have a and by the improved predictive validity of GPR compared rate of under-5 mortality of more than 200 per 1000 in with other methods.Loess forecasts used in the 2007 2010 whereas 12 did in 1990.Although progress has been analysis by Murray and colleagues'tend towards the slowest in sub-Saharan Africa and Oceania,there is clear average long-term rate of decline in countries;when evidence of accelerating rates of decline in under-5 mortality decline is accelerating.these forecasts proved to mortality in all regions of sub-Saharan Africa.Rates of be too conservative.The change in the overall numbers under-5 mortality in 25 countries in sub-Saharan Africa and the even more striking change in the estimated rates are now declining at more than 2%per year:in 34countries of decline from 1990 to 2008 due to new data and improved in this region,the rate of decline has increased in the methods highlight why it is important to continually period 2000-10 compared with 1990-2000. update and refine the measurement of child mortality. This assessment yields substantially lower estimates of Our assessment of rates of change is also notably different child mortality than did previous studies.For example, than that done by UNICEF;the correlation coefficient of UNICEF reported 8.77 million deaths in 2008,and we yearly rates of change from 1990 to 2008 in the two www.thelancet.com Vol 375 June 5,2010 2005Articles www.thelancet.com Vol 375 June 5, 2010 2005 children younger than 5 years declined by 35% from 1990 to 2010, a yearly rate of 2·1%. This rate of decline is lower than the MDG 4 target of 4·4% per year but represents substantial progress across countries; no countries have a rate of under-5 mortality of more than 200 per 1000 in 2010 whereas 12 did in 1990. Although progress has been slowest in sub-Saharan Africa and Oceania, there is clear evidence of accelerating rates of decline in under-5 mortality in all regions of sub-Saharan Africa. Rates of under-5 mortality in 25 countries in sub-Saharan Africa are now declining at more than 2% per year; in 34 countries in this region, the rate of decline has increased in the period 2000–10 compared with 1990–2000. This assessment yields substantially lower estimates of child mortality than did previous studies. For example, UNICEF reported 8·77 million deaths in 2008, and we estimated 7·95 million for the same year. Our lower estimate is largely driven by newer surveys that show that declines in child mortality have been faster than projected and by the improved predictive validity of GPR compared with other methods. Loess forecasts used in the 2007 analysis by Murray and colleagues1 tend towards the average long-term rate of decline in countries; when mortality decline is accelerating, these forecasts proved to be too conservative. The change in the overall numbers and the even more striking change in the estimated rates of decline from 1990 to 2008 due to new data and improved methods highlight why it is important to continually update and refi ne the measurement of child mortality. Our assessment of rates of change is also notably diff erent than that done by UNICEF; the correlation coeffi cient of yearly rates of change from 1990 to 2008 in the two 0 Neonatal Postneonatal Asia, Pacific, high income Childhood Under-5 Neonatal Postneonatal Childhood Under-5 Neonatal Postneonatal Childhood Under-5 Neonatal Postneonatal Childhood Under-5 Neonatal Postneonatal Childhood Under-5 Neonatal Postneonatal Childhood Under-5 Neonatal Postneonatal Childhood Under-5 2 4 6 8 Asia, central Asia, east Asia, south Asia, southeast Australasia Caribbean 0 Europe, central 2 4 6 8 Europe, eastern Europe, western Latin America, Andean Latin America, central Latin America, southern Latin America, tropical 0 North Africa/ Middle East 2 4 Yearly decline (%) Yearly decline (%) Yearly decline (%) 6 8 North America, high income Oceania Sub-Saharan Africa, central Sub-Saharan Africa, east Sub-saharan Africa, southern Sub-Saharan Africa, west Figure 7: Yearly percentage decline in under-5, neonatal, postneonatal, and childhood mortality between 1990 and 2010, by region Error bars represent uncertainty intervals. Under-5 mortality is defi ned as the probability of death between birth and age 5 years. See text for defi nitions of neonatal, postneonatal, and childhood mortality