正在加载图片...

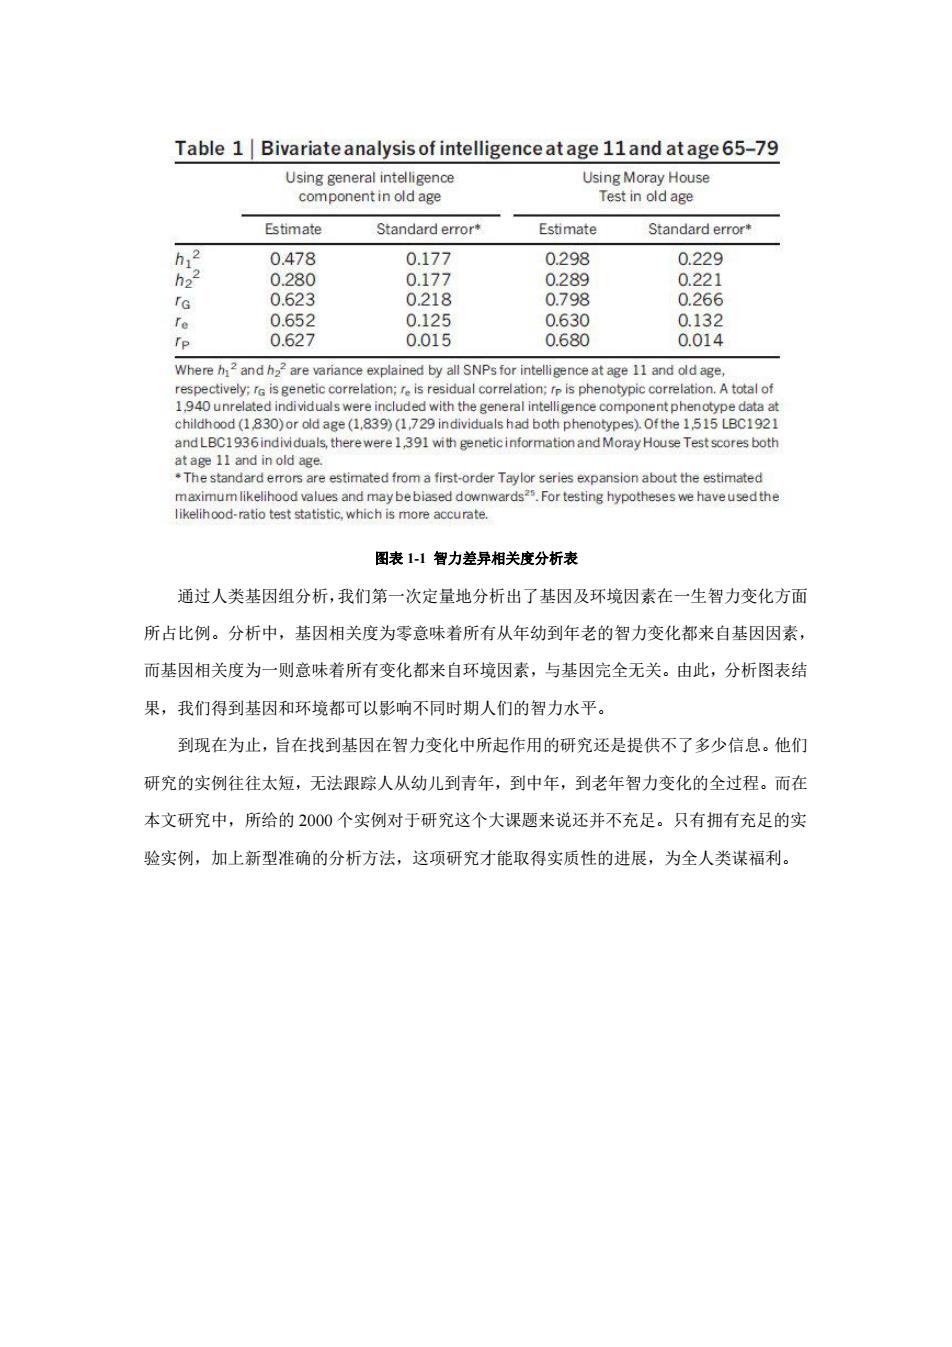
Table 1 Bivariate analysis of intelligence at age 11and atage 65-79 Using general intelligence Using Moray House component in old age Test in old age Estimate Standard error' Estimate Standard error" h12 0.478 0.177 0.298 0.229 h22 0.280 0.177 0.289 0.221 G 0.623 0.218 0.798 0.266 Te 0.652 0.125 0.630 0.132 Tp 0.627 0.015 0.680 0.014 Where h2 and h22 are variance explained by all SNPs for intelligence at age 11 and old age respectively;ra is genetic correlation;re is residual correlation;rp is phenotypic correlation.A total of 1.940 unrelated individuals were included with the general intelligence component phenotype data at childhood(1830)or old age(1,839)(1,729 individuals had both phenotypes).Ofthe 1,515 LBC1921 and LBC1936individuals,there were 1,391 with geneticinformation and Moray House Test scores both at age 11 and in old age. The standard errors are estimated from a first-order Taylor series expansion about the estimated maximumlikelihood values and may be biased downwards25.For testing hypotheses we have used the likelihood-ratio test statistic,which is more accurate. 图表1-1智力差异相关度分析表 通过人类基因组分析,我们第一次定量地分析出了基因及环境因素在一生智力变化方面 所占比例。分析中,基因相关度为零意味着所有从年幼到年老的智力变化都来自基因因素, 而基因相关度为一则意味着所有变化都来自环境因素,与基因完全无关。由此,分析图表结 果,我们得到基因和环境都可以影响不同时期人们的智力水平。 到现在为止,旨在找到基因在智力变化中所起作用的研究还是提供不了多少信息。他们 研究的实例往往太短,无法跟踪人从幼儿到青年,到中年,到老年智力变化的全过程。而在 本文研究中,所给的2000个实例对于研究这个大课题来说还并不充足。只有拥有充足的实 验实例,加上新型准确的分析方法,这项研究才能取得实质性的进展,为全人类谋福利。图表 1-1 智力差异相关度分析表 通过人类基因组分析,我们第一次定量地分析出了基因及环境因素在一生智力变化方面 所占比例。分析中,基因相关度为零意味着所有从年幼到年老的智力变化都来自基因因素, 而基因相关度为一则意味着所有变化都来自环境因素,与基因完全无关。由此,分析图表结 果,我们得到基因和环境都可以影响不同时期人们的智力水平。 到现在为止,旨在找到基因在智力变化中所起作用的研究还是提供不了多少信息。他们 研究的实例往往太短,无法跟踪人从幼儿到青年,到中年,到老年智力变化的全过程。而在 本文研究中,所给的 2000 个实例对于研究这个大课题来说还并不充足。只有拥有充足的实 验实例,加上新型准确的分析方法,这项研究才能取得实质性的进展,为全人类谋福利