正在加载图片...

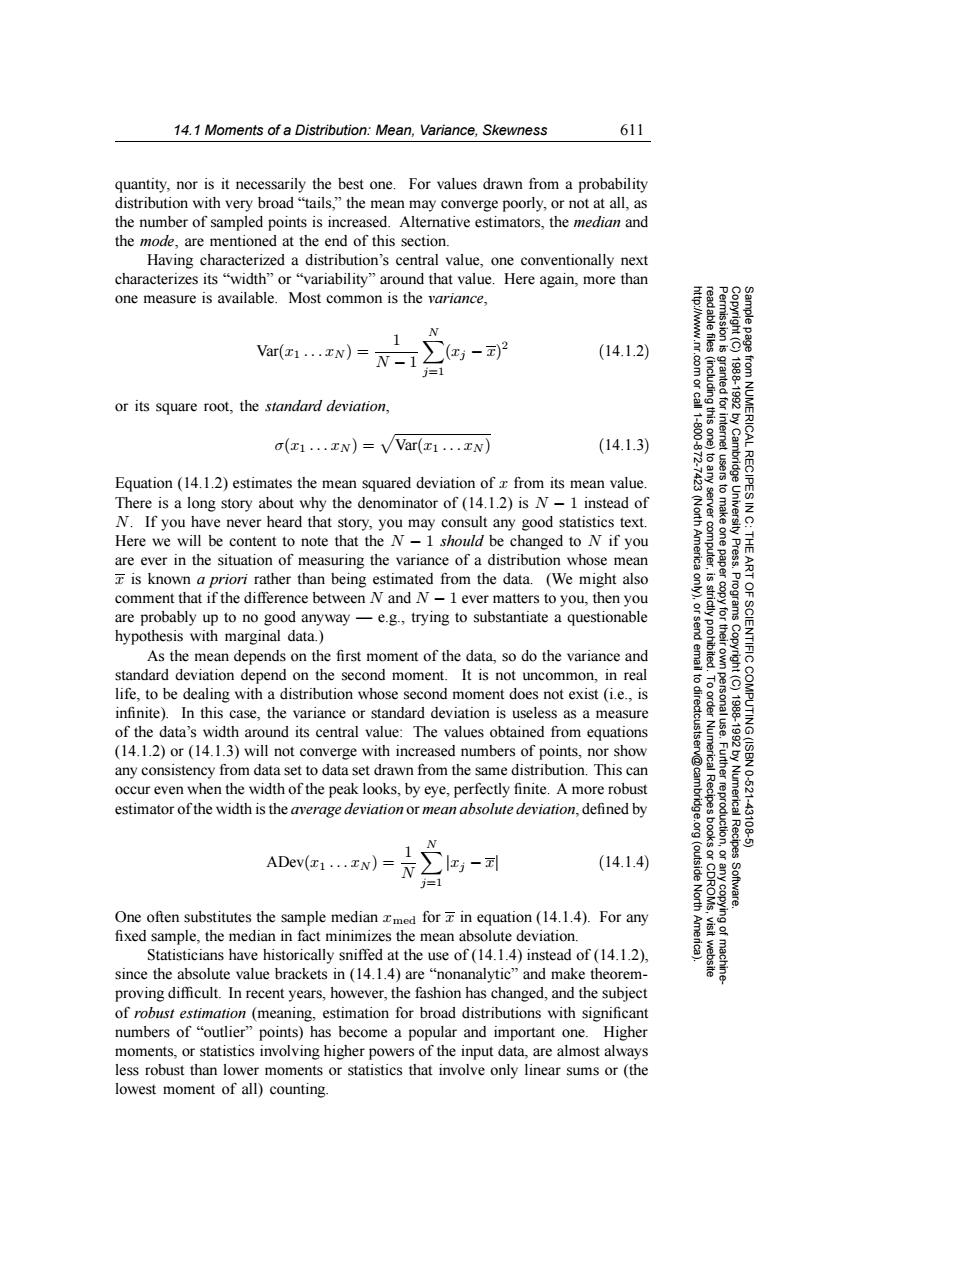
14.1 Moments of a Distribution:Mean,Variance,Skewness 611 quantity,nor is it necessarily the best one.For values drawn from a probability distribution with very broad"tails,"the mean may converge poorly,or not at all,as the number of sampled points is increased.Alternative estimators,the median and the mode,are mentioned at the end of this section. Having characterized a distribution's central value,one conventionally next characterizes its“width”or“variability”around that value.Here again,.more than one measure is available.Most common is the variance, N (14.1.2) j=1 or its square root,the standard deviation, a(1...N)=VVar(x1...IN) (14.1.3) 、 ICAL Equation(14.1.2)estimates the mean squared deviation of x from its mean value. There is a long story about why the denominator of(14.1.2)is N-1 instead of N.If you have never heard that story,you may consult any good statistics text. Here we will be content to note that the N-1 should be changed to N if you are ever in the situation of measuring the variance of a distribution whose mean 个 9 is known a priori rather than being estimated from the data.(We might also comment that if the difference between N and N-1 ever matters to you,then you 9 are probably up to no good anyway-e.g.,trying to substantiate a questionable 的n hypothesis with marginal data.) As the mean depends on the first moment of the data,so do the variance and standard deviation depend on the second moment.It is not uncommon,in real life,to be dealing with a distribution whose second moment does not exist(ie.,is infinite).In this case,the variance or standard deviation is useless as a measure of the data's width around its central value:The values obtained from equations (14.1.2)or(14.1.3)will not converge with increased numbers of points,nor show any consistency from data set to data set drawn from the same distribution.This can occur even when the width of the peak looks,by eye,perfectly finite.A more robust estimator of the width is the average deviation or mean absolute deviation,defined by Numerica 10621 43106 ADev(1...N)= (14.1.4) j=1 One often substitutes the sample median zmed for in equation(14.1.4).For any fixed sample,the median in fact minimizes the mean absolute deviation Statisticians have historically sniffed at the use of(14.1.4)instead of(14.1.2), since the absolute value brackets in (14.1.4)are "nonanalytic"and make theorem- proving difficult.In recent years,however,the fashion has changed,and the subject of robust estimation(meaning,estimation for broad distributions with significant numbers of "outlier"points)has become a popular and important one.Higher moments,or statistics involving higher powers of the input data,are almost always less robust than lower moments or statistics that involve only linear sums or(the lowest moment of all)counting14.1 Moments of a Distribution: Mean, Variance, Skewness 611 Permission is granted for internet users to make one paper copy for their own personal use. Further reproduction, or any copyin Copyright (C) 1988-1992 by Cambridge University Press. Programs Copyright (C) 1988-1992 by Numerical Recipes Software. Sample page from NUMERICAL RECIPES IN C: THE ART OF SCIENTIFIC COMPUTING (ISBN 0-521-43108-5) g of machinereadable files (including this one) to any server computer, is strictly prohibited. To order Numerical Recipes books or CDROMs, visit website http://www.nr.com or call 1-800-872-7423 (North America only), or send email to directcustserv@cambridge.org (outside North America). quantity, nor is it necessarily the best one. For values drawn from a probability distribution with very broad “tails,” the mean may converge poorly, or not at all, as the number of sampled points is increased. Alternative estimators, the median and the mode, are mentioned at the end of this section. Having characterized a distribution’s central value, one conventionally next characterizes its “width” or “variability” around that value. Here again, more than one measure is available. Most common is the variance, Var(x1 ...xN ) = 1 N − 1 N j=1 (xj − x) 2 (14.1.2) or its square root, the standard deviation, σ(x1 ...xN ) = Var(x1 ...xN ) (14.1.3) Equation (14.1.2) estimates the mean squared deviation of x from its mean value. There is a long story about why the denominator of (14.1.2) is N − 1 instead of N. If you have never heard that story, you may consult any good statistics text. Here we will be content to note that the N − 1 should be changed to N if you are ever in the situation of measuring the variance of a distribution whose mean x is known a priori rather than being estimated from the data. (We might also comment that if the difference between N and N − 1 ever matters to you, then you are probably up to no good anyway — e.g., trying to substantiate a questionable hypothesis with marginal data.) As the mean depends on the first moment of the data, so do the variance and standard deviation depend on the second moment. It is not uncommon, in real life, to be dealing with a distribution whose second moment does not exist (i.e., is infinite). In this case, the variance or standard deviation is useless as a measure of the data’s width around its central value: The values obtained from equations (14.1.2) or (14.1.3) will not converge with increased numbers of points, nor show any consistency from data set to data set drawn from the same distribution. This can occur even when the width of the peak looks, by eye, perfectly finite. A more robust estimator of the width is the average deviation or mean absolute deviation, defined by ADev(x1 ...xN ) = 1 N N j=1 |xj − x| (14.1.4) One often substitutes the sample median xmed for x in equation (14.1.4). For any fixed sample, the median in fact minimizes the mean absolute deviation. Statisticians have historically sniffed at the use of (14.1.4) instead of (14.1.2), since the absolute value brackets in (14.1.4) are “nonanalytic” and make theoremproving difficult. In recent years, however, the fashion has changed, and the subject of robust estimation (meaning, estimation for broad distributions with significant numbers of “outlier” points) has become a popular and important one. Higher moments, or statistics involving higher powers of the input data, are almost always less robust than lower moments or statistics that involve only linear sums or (the lowest moment of all) counting.�