正在加载图片...
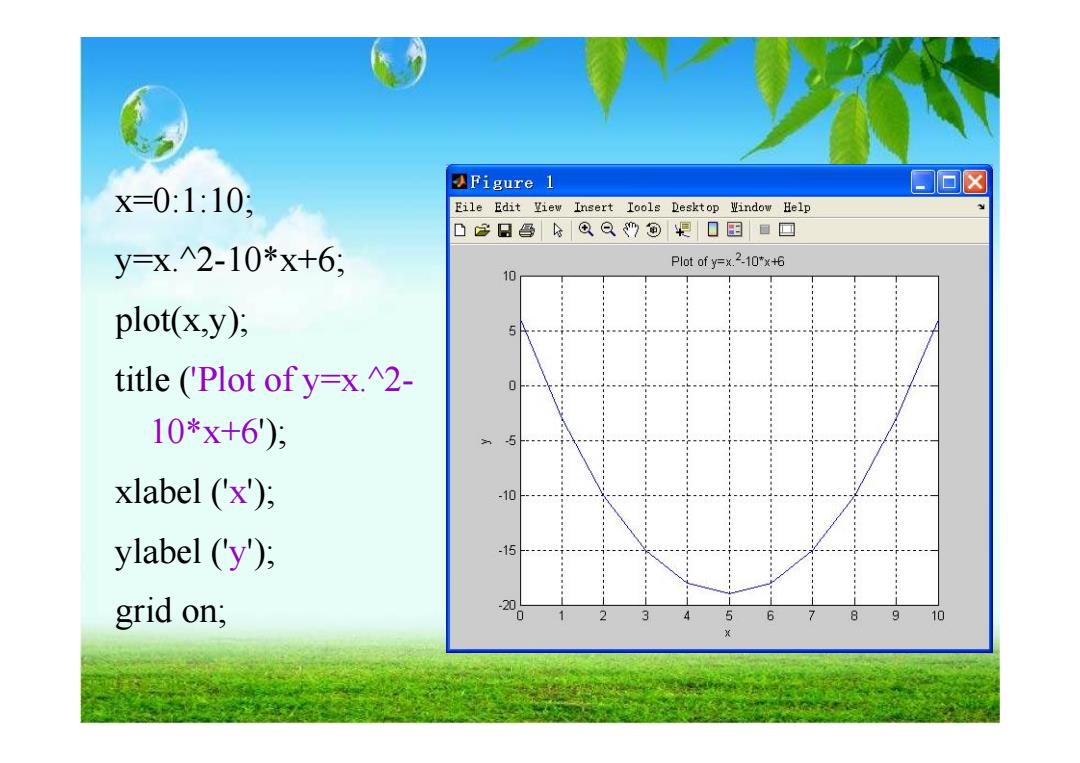
Figure 1 x=0:1:10; Eile Edit Yiew Insert Iools Desktop Window Help 03日鲁QQ”⊙提口国▣▣ y=X.2-10*x+6; Plot of y=x.2.10*x+6 10 plot(x,y); title ('Plot of y=x.12- 10*x+6): xlabel ('x'); ylabel (y'); 15 grid on; -20 1011 x=0:1:10; y=x.^2-10 *x+6; plot(x,y); title ('Plot of y=x.^2- 10 *x+6'); xlabel (' x'); ylabel (' y'); grid on;