正在加载图片...
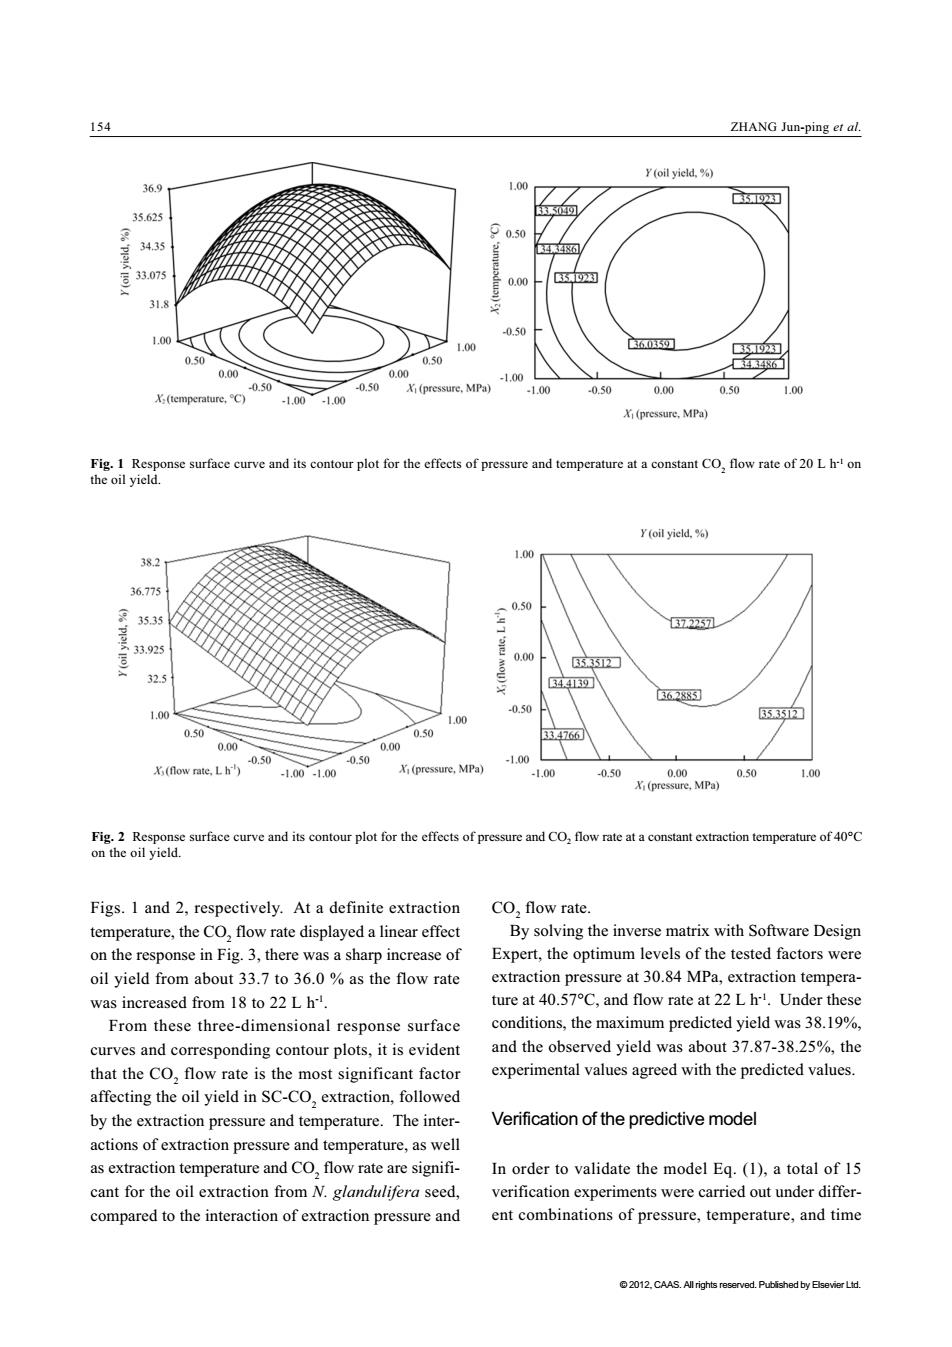
154 ZHANG Jun-ping et al. Y(oil yield,%) 36.9 1.00 35.625 0.50 34.35 8 33.075 0.00 R图 31.8 -0.50 1.00 1.00 69 59少2水】 0.50 0.50 0.00 0.00 -1.00 0.50 -0.50 X(pressure,MPa) -1.00 -0.50 0.00 0.50 1.00 X(temperature,C) -1.00-1.00 Xi(pressure,MPa】 Fig.1 Response surface curve and its contour plot for the effects of pressure and temperature at a constant CO,flow rate of 20 L h!on the oil yield. Y(oil yield.%) 38.2 1.00 36.775 35.35 372257 33.92 0.00 35352☐ 32.5 34439 362885 100 -0.50 1.00 35352 0.50 0.50 334766 0.00 0.00 -0.50 -0.50 -1.00 (flow rate,Lh) -1.00-1.00 (pressure,MPa) -1.00 -0.50 0.00 0.50 1.00 Xi(pressure,MPa) Fig.2 Response surface curve and its contour plot for the effects of pressure and CO,flow rate at a constant extraction temperature of 40C on the oil yield. Figs.1 and 2,respectively.At a definite extraction CO,flow rate. temperature,the CO,flow rate displayed a linear effect By solving the inverse matrix with Software Design on the response in Fig.3,there was a sharp increase of Expert,the optimum levels of the tested factors were oil yield from about 33.7 to 36.0%as the flow rate extraction pressure at 30.84 MPa,extraction tempera- was increased from 18 to 22 L h. ture at 40.57C,and flow rate at 22 L h.Under these From these three-dimensional response surface conditions,the maximum predicted yield was 38.19%, curves and corresponding contour plots,it is evident and the observed yield was about 37.87-38.25%,the that the CO,flow rate is the most significant factor experimental values agreed with the predicted values. affecting the oil yield in SC-CO,extraction,followed by the extraction pressure and temperature.The inter- Verification of the predictive model actions of extraction pressure and temperature,as well as extraction temperature and CO,flow rate are signifi- In order to validate the model Eq.(1),a total of 15 cant for the oil extraction from N.glandulifera seed. verification experiments were carried out under differ- compared to the interaction of extraction pressure and ent combinations of pressure,temperature,and time 2012.CAAS.All rights reserved.Published by Elsevier Ltd.154 ZHANG Jun-ping et al. © 2012, CAAS. All rights reserved. Published by Elsevier Ltd. Fig. 2 Response surface curve and its contour plot for the effects of pressure and CO2 flow rate at a constant extraction temperature of 40°C on the oil yield. Fig. 1 Response surface curve and its contour plot for the effects of pressure and temperature at a constant CO2 flow rate of 20 L h-1 on the oil yield. Figs. 1 and 2, respectively. At a definite extraction temperature, the CO2 flow rate displayed a linear effect on the response in Fig. 3, there was a sharp increase of oil yield from about 33.7 to 36.0 % as the flow rate was increased from 18 to 22 L h-1. From these three-dimensional response surface curves and corresponding contour plots, it is evident that the CO2 flow rate is the most significant factor affecting the oil yield in SC-CO2 extraction, followed by the extraction pressure and temperature. The interactions of extraction pressure and temperature, as well as extraction temperature and CO2 flow rate are significant for the oil extraction from N. glandulifera seed, compared to the interaction of extraction pressure and CO2 flow rate. By solving the inverse matrix with Software Design Expert, the optimum levels of the tested factors were extraction pressure at 30.84 MPa, extraction temperature at 40.57°C, and flow rate at 22 L h-1. Under these conditions, the maximum predicted yield was 38.19%, and the observed yield was about 37.87-38.25%, the experimental values agreed with the predicted values. Verification of the predictive model In order to validate the model Eq. (1), a total of 15 verification experiments were carried out under different combinations of pressure, temperature, and time