正在加载图片...
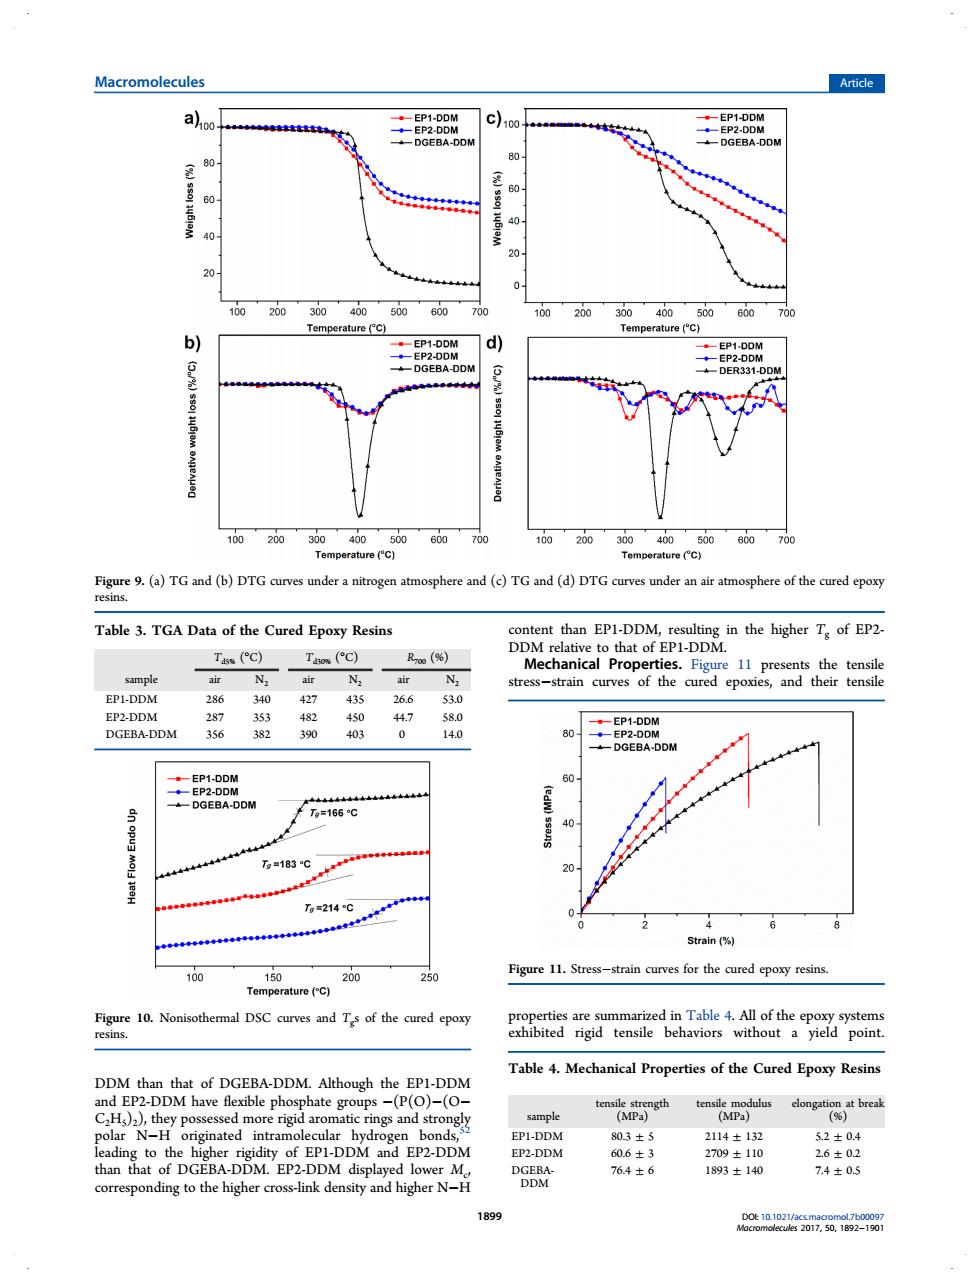
Macromolecules Aricle 88cm 主8 20 200 00 200 70 d 1020 200 30040 reo0 ()()G m Table 3.TGA Data of the Cured Epoxy Resins Tas("c) Tao (C) R(%) Mechanical Prop ERLDDM 340427435 266 353 447 20 =2140 2 turo (C) 20 Figure 11.Stress-strain curves for the cured epoxy resins. otheral DSC curves and T of the cured epory Table 4.Mechanical Properties of the Cured Epoxy Resins P2-DDM nding to the highe density and higher NH 8cnaDDM than that of DGEBA-DDM. Although the EP1-DDM and EP2-DDM have flexible phosphate groups −(P(O)−(O− C2H5)2), they possessed more rigid aromatic rings and strongly polar N−H originated intramolecular hydrogen bonds,52 leading to the higher rigidity of EP1-DDM and EP2-DDM than that of DGEBA-DDM. EP2-DDM displayed lower Mc, corresponding to the higher cross-link density and higher N−H content than EP1-DDM, resulting in the higher Tg of EP2- DDM relative to that of EP1-DDM. Mechanical Properties. Figure 11 presents the tensile stress−strain curves of the cured epoxies, and their tensile properties are summarized in Table 4. All of the epoxy systems exhibited rigid tensile behaviors without a yield point. Figure 9. (a) TG and (b) DTG curves under a nitrogen atmosphere and (c) TG and (d) DTG curves under an air atmosphere of the cured epoxy resins. Table 3. TGA Data of the Cured Epoxy Resins Td5% (°C) Td30% (°C) R700 (%) sample air N2 air N2 air N2 EP1-DDM 286 340 427 435 26.6 53.0 EP2-DDM 287 353 482 450 44.7 58.0 DGEBA-DDM 356 382 390 403 0 14.0 Figure 10. Nonisothermal DSC curves and Tgs of the cured epoxy resins. Figure 11. Stress−strain curves for the cured epoxy resins. Table 4. Mechanical Properties of the Cured Epoxy Resins sample tensile strength (MPa) tensile modulus (MPa) elongation at break (%) EP1-DDM 80.3 ± 5 2114 ± 132 5.2 ± 0.4 EP2-DDM 60.6 ± 3 2709 ± 110 2.6 ± 0.2 DGEBADDM 76.4 ± 6 1893 ± 140 7.4 ± 0.5 Macromolecules Article DOI: 10.1021/acs.macromol.7b00097 Macromolecules 2017, 50, 1892−1901 1899