正在加载图片...
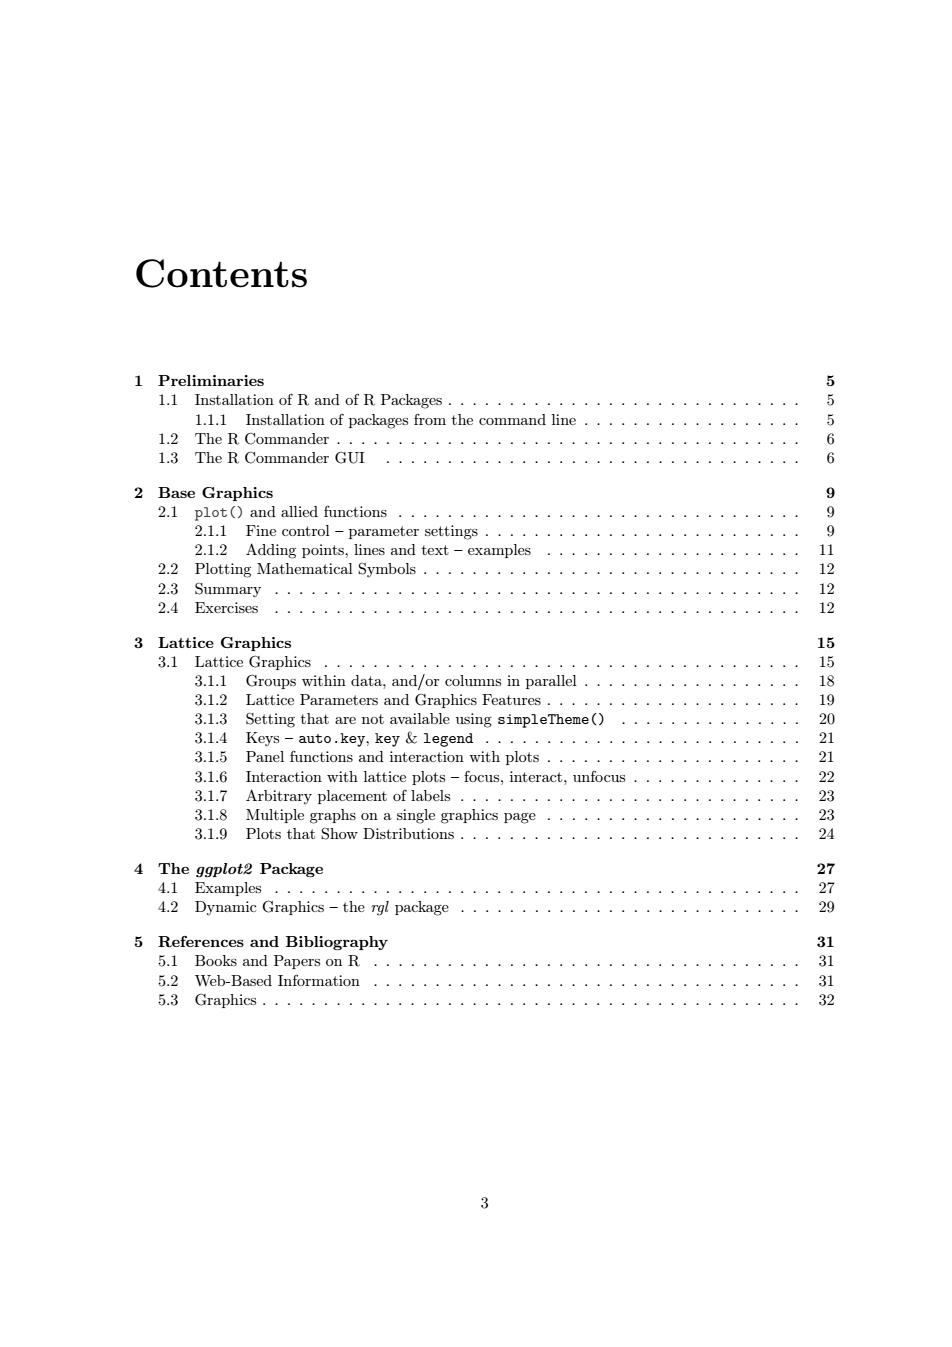
Contents 1 Preliminaries 5 1.1 Installation of R and of R Packages.··.·。··.··················· 5 l.l.1 nstallation of packages from the command line..,··.···········, 5 l.2 The R Commander,································ 6 1.3 The R Commander GUI 6 2 Base Graphics 9 2 1 plot()and allied functions.:·。·.························· 9 2.l.1 Fine control-parameter settings...............·.·.·.····· 9 2.l.2 Adding points,lines and text-examples····················· 2.2 Plotting Mathematical Symbols..........·..··......·....·.... 12 2.3 Summary 12 2.4 Exercises 3 Lattice Graphics 15 3.1 Lattice Graphics 15 3.1.1 Groups within data,and/or columns in parallel ................. 18 3.l.2 Lattice Parameters and Graphics Features.,.·················· 19 3.1.3 Setting that are not available using simpleTheme() 20 3.l.4Keys-auto.key,key&legend.......................... 21 3.1.5 Panel functions and interaction with plots.. 2 3.l.6 Interaction with lattice plots-focus,interact,.unfocus.......·:···.. 22 3.1.7 Arbitrary placement of labels.···.·············· 2 3.l.8 Multiple graphs on a single graphics page····················· 23 3.l.9 Plots that Show Distributions.·.·.....·..·.·...。.. 24 4 The ggplot2 Package 27 4.2 Dynamic Graphics-the rgl package............................ 29 5 References and Bibliography 31 5.1 Books and Papers on R..······ 5.2Web-Based Information······· 1 5.3 Graphics.·。··········· 32 3Contents 1 Preliminaries 5 1.1 Installation of R and of R Packages . . . . . . . . . . . . . . . . . . . . . . . . . . . . . 5 1.1.1 Installation of packages from the command line . . . . . . . . . . . . . . . . . . 5 1.2 The R Commander . . . . . . . . . . . . . . . . . . . . . . . . . . . . . . . . . . . . . . 6 1.3 The R Commander GUI . . . . . . . . . . . . . . . . . . . . . . . . . . . . . . . . . . 6 2 Base Graphics 9 2.1 plot() and allied functions . . . . . . . . . . . . . . . . . . . . . . . . . . . . . . . . . 9 2.1.1 Fine control – parameter settings . . . . . . . . . . . . . . . . . . . . . . . . . . 9 2.1.2 Adding points, lines and text – examples . . . . . . . . . . . . . . . . . . . . . 11 2.2 Plotting Mathematical Symbols . . . . . . . . . . . . . . . . . . . . . . . . . . . . . . . 12 2.3 Summary . . . . . . . . . . . . . . . . . . . . . . . . . . . . . . . . . . . . . . . . . . . 12 2.4 Exercises . . . . . . . . . . . . . . . . . . . . . . . . . . . . . . . . . . . . . . . . . . . 12 3 Lattice Graphics 15 3.1 Lattice Graphics . . . . . . . . . . . . . . . . . . . . . . . . . . . . . . . . . . . . . . . 15 3.1.1 Groups within data, and/or columns in parallel . . . . . . . . . . . . . . . . . . 18 3.1.2 Lattice Parameters and Graphics Features . . . . . . . . . . . . . . . . . . . . . 19 3.1.3 Setting that are not available using simpleTheme() . . . . . . . . . . . . . . . 20 3.1.4 Keys – auto.key, key & legend . . . . . . . . . . . . . . . . . . . . . . . . . . 21 3.1.5 Panel functions and interaction with plots . . . . . . . . . . . . . . . . . . . . . 21 3.1.6 Interaction with lattice plots – focus, interact, unfocus . . . . . . . . . . . . . . 22 3.1.7 Arbitrary placement of labels . . . . . . . . . . . . . . . . . . . . . . . . . . . . 23 3.1.8 Multiple graphs on a single graphics page . . . . . . . . . . . . . . . . . . . . . 23 3.1.9 Plots that Show Distributions . . . . . . . . . . . . . . . . . . . . . . . . . . . . 24 4 The ggplot2 Package 27 4.1 Examples . . . . . . . . . . . . . . . . . . . . . . . . . . . . . . . . . . . . . . . . . . . 27 4.2 Dynamic Graphics – the rgl package . . . . . . . . . . . . . . . . . . . . . . . . . . . . 29 5 References and Bibliography 31 5.1 Books and Papers on R . . . . . . . . . . . . . . . . . . . . . . . . . . . . . . . . . . . 31 5.2 Web-Based Information . . . . . . . . . . . . . . . . . . . . . . . . . . . . . . . . . . . 31 5.3 Graphics . . . . . . . . . . . . . . . . . . . . . . . . . . . . . . . . . . . . . . . . . . . . 32 3