正在加载图片...
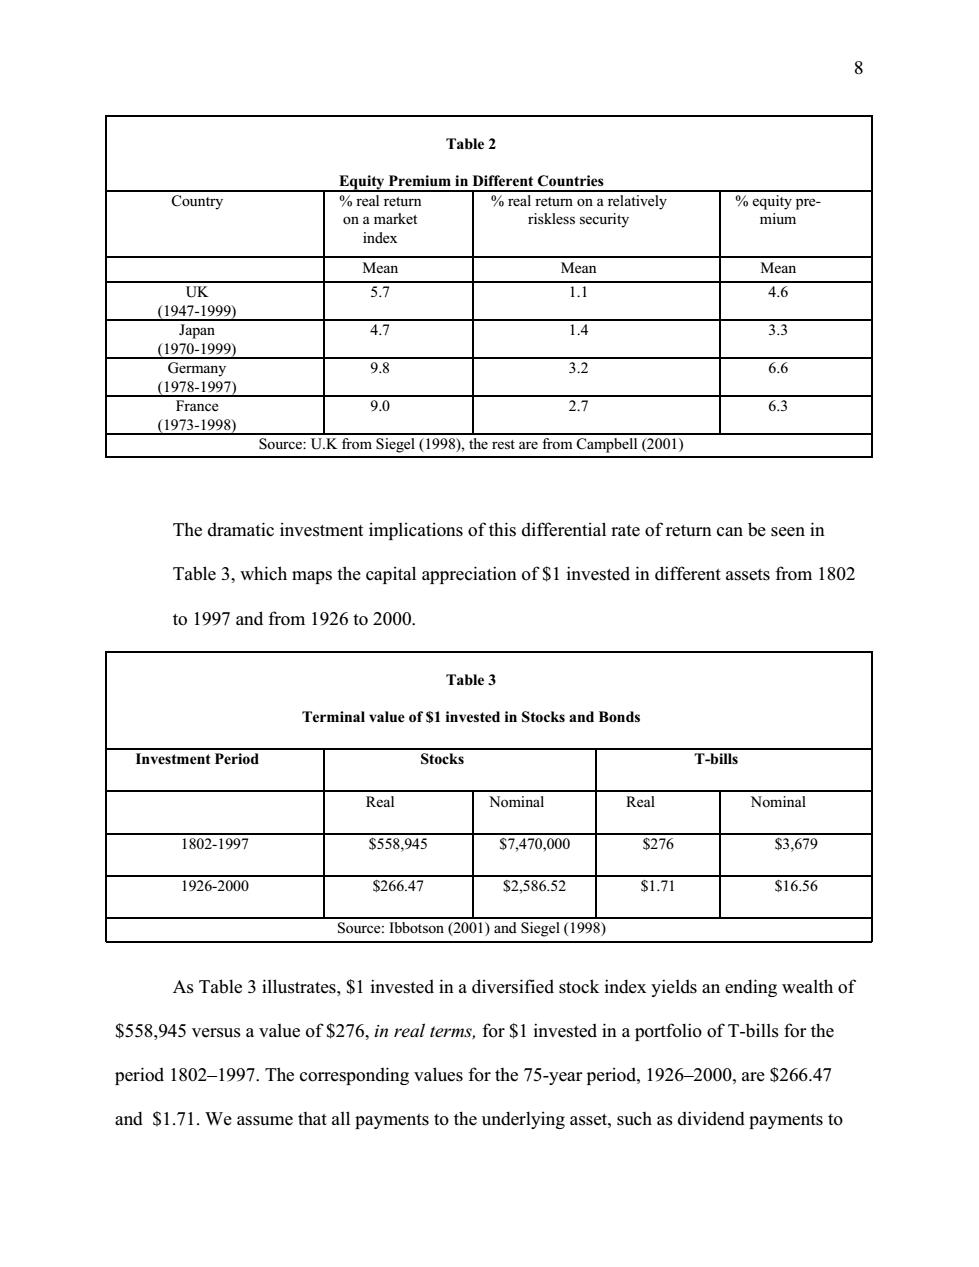
P Table 2 Equity Premium in Different Countries Country real return real return on a relatively %equity pre- on a market riskless security mium index Mean Mean Mean UK 5.7 1.1 4.6 (1947-1999) Japan 4.7 1.4 3.3 (1970-1999) Germany 9.8 3.2 6.6 (1978-1997 France 9.0 2.7 6.3 (1973-1998) Source:U.K from Siegel (1998),the rest are from Campbell (2001) The dramatic investment implications of this differential rate of return can be seen in Table 3,which maps the capital appreciation of $1 invested in different assets from 1802 to 1997 and from 1926 to 2000. Table3 Terminal value of $1 invested in Stocks and Bonds Investment Period Stocks T-bills Real Nominal Real Nominal 1802-1997 $558,945 $7.470,000 $276 $3,679 1926-2000 $266.47 $2,586.52 $1.71 $16.56 Source:Ibbotson(2001)and Siegel(1998) As Table 3 illustrates,$1 invested in a diversified stock index yields an ending wealth of $558,945 versus a value of $276,in real terms,for $1 invested in a portfolio of T-bills for the period 1802-1997.The corresponding values for the 75-year period,1926-2000,are $266.47 and $1.71.We assume that all payments to the underlying asset,such as dividend payments to8 Table 2 Equity Premium in Different Countries Country % real return on a market index % real return on a relatively riskless security % equity premium Mean Mean Mean UK (1947-1999) 5.7 1.1 4.6 Japan (1970-1999) 4.7 1.4 3.3 Germany (1978-1997) 9.8 3.2 6.6 France (1973-1998) 9.0 2.7 6.3 Source: U.K from Siegel (1998), the rest are from Campbell (2001) The dramatic investment implications of this differential rate of return can be seen in Table 3, which maps the capital appreciation of $1 invested in different assets from 1802 to 1997 and from 1926 to 2000. Table 3 Terminal value of $1 invested in Stocks and Bonds Investment Period Stocks T-bills Real Nominal Real Nominal 1802-1997 $558,945 $7,470,000 $276 $3,679 1926-2000 $266.47 $2,586.52 $1.71 $16.56 Source: Ibbotson (2001) and Siegel (1998) As Table 3 illustrates, $1 invested in a diversified stock index yields an ending wealth of $558,945 versus a value of $276, in real terms, for $1 invested in a portfolio of T-bills for the period 1802–1997. The corresponding values for the 75-year period, 1926–2000, are $266.47 and $1.71. We assume that all payments to the underlying asset, such as dividend payments to