正在加载图片...
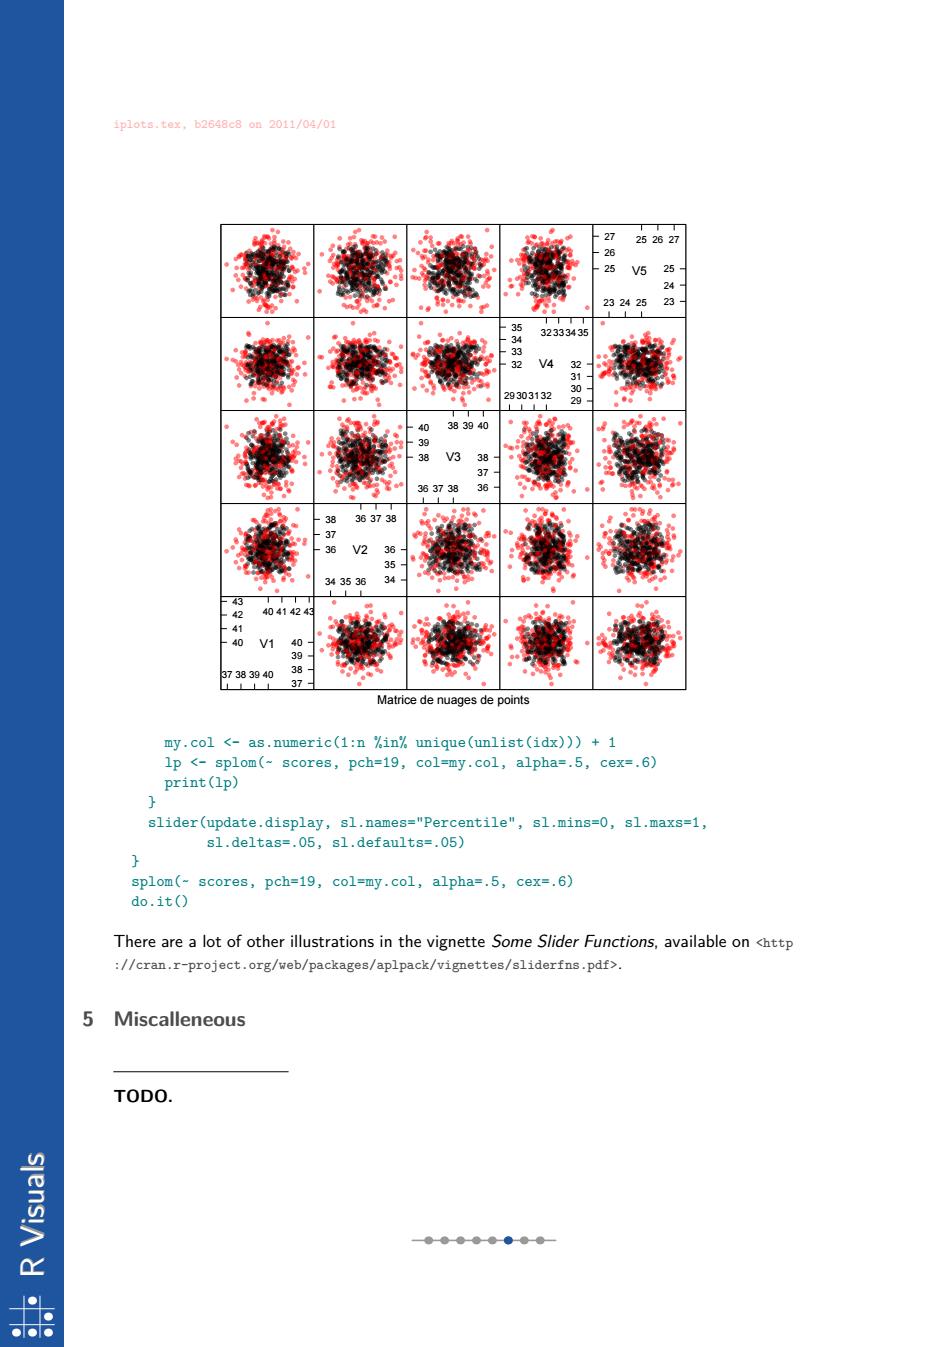
1p1ots.tex,b2648c8on2011/04/01 27 25 2627 26 25 V5 24 232425 23 35 32333435 33 32 V4 32 29303132 30 29 0 3 3730 35 34 35 36 34 43 2 40414243 40 V1 40 37383940 38 Matrice de nuages de points my.col <-as.numeric(1:n %in%unique(unlist(idx)))+1 lp <-splom(-scores,pch=19,col=my.col,alpha=.5,cex=.6) print(Ip) slider(update.display,sl.names="Percentile",sl.mins=0,sl.maxs=1, sl.deltas=.05,sl.defaults=.05) splom(-scores,pch=19,col=my.col,alpha=.5,cex=.6) do.it() There are a lot of other illustrations in the vignette Some Slider Functions,available on <http //cran.r-project.org/web/packages/aplpack/vignettes/sliderfns.pdf>. 5 Miscalleneous TODO. sjens!A d ●●●●●●-●● 是R Visuals iplots.tex, b2648c8 on 2011/04/01 Matrice de nuages de points 40 V1 41 42 43 40 41 42 43 37 38 39 40 37 38 39 40 36 V2 37 38 36 37 38 34 35 36 34 35 36 38 V3 39 40 38 39 40 36 37 38 36 37 38 32 V4 33 34 35 32 33 34 35 29 30 31 32 29 30 31 32 25 V5 26 27 25 26 27 23 24 25 23 24 25 my.col <- as.numeric(1:n %in% unique(unlist(idx))) + 1 lp <- splom(~ scores, pch=19, col=my.col, alpha=.5, cex=.6) print(lp) } slider(update.display, sl.names="Percentile", sl.mins=0, sl.maxs=1, sl.deltas=.05, sl.defaults=.05) } splom(~ scores, pch=19, col=my.col, alpha=.5, cex=.6) do.it() There are a lot of other illustrations in the vignette Some Slider Functions, available on <http ://cran.r-project.org/web/packages/aplpack/vignettes/sliderfns.pdf>. 5 Miscalleneous TODO