正在加载图片...
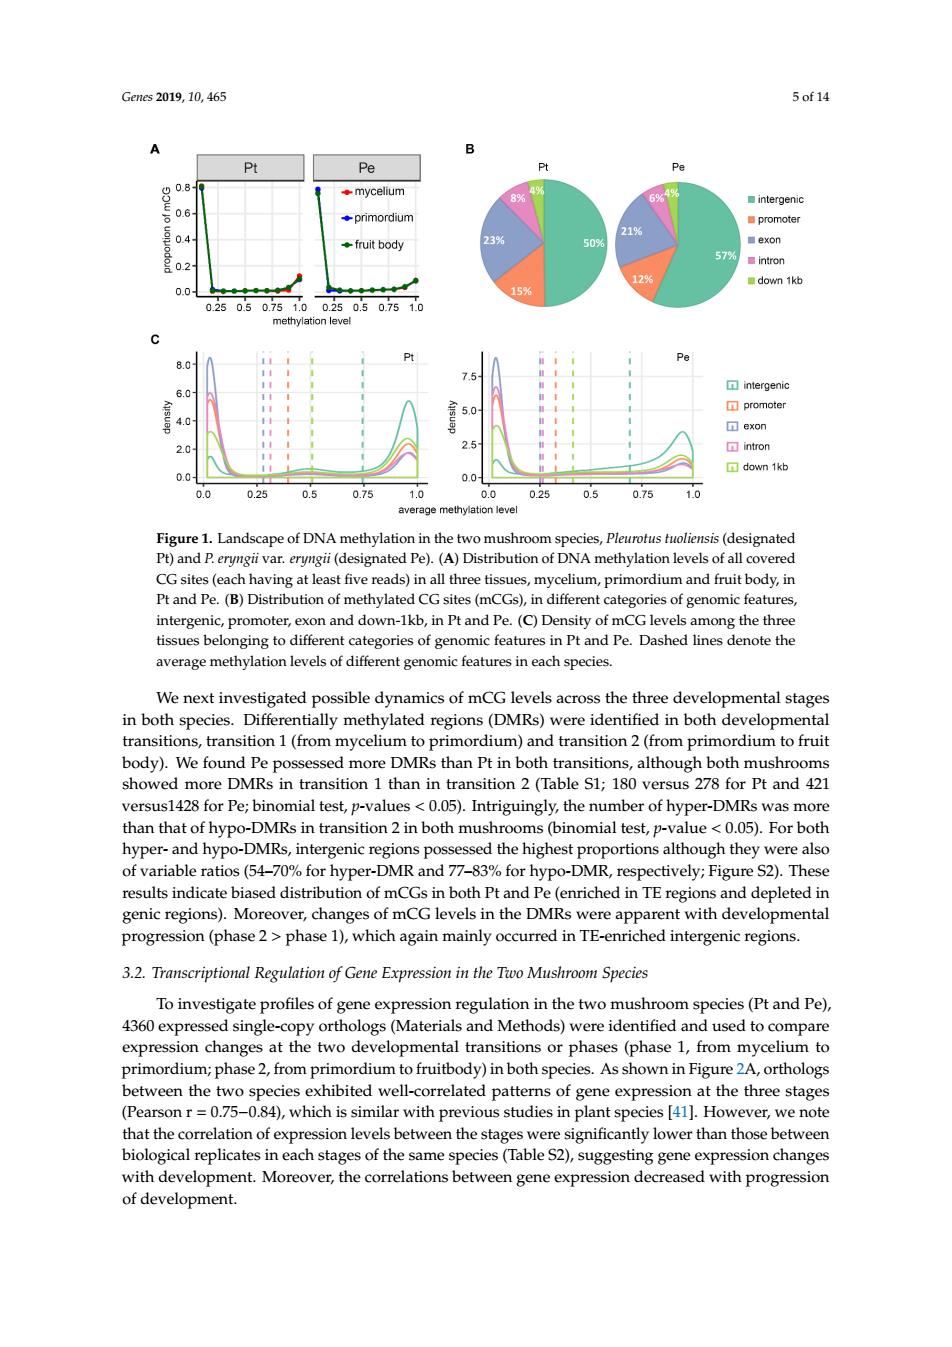
Gs2019,10,465 5of14 9 Pe g02 Pt 8.a 0 dow 0.0 025 0.5 07 0.25 0.5 07516 Figure 1.Landscape of DNA methylation in the two mushroom sp ecies,Pleurotus tuoliensis (designated Pt)and P.eryngii var.rymgi(designated Pe).(A)Distribution of DNA methylation levels of all covered prim intergenic,promoter,exon and down-1kb,in Pt and Pe.(C)Density of mCG levels mone the three tissues belonging to different categories of genomic features in Pt and Pe.Dashed lines denote the average methylation levels of different genomic features in each species. We next investigated possible dynamics of mCG levels across the three developmental stages in both species.Differentially methylated regions(DMRs)were identified in both developmental transitions,transition 1(from mycelium to primordium)and transition 2( rom primordium to frui body).We found te DMks than Pt in mush for Pe 005.ln ind 421 than that of h DMRs in ition in hoth iue<005).For both rand hy ssessed the highest proportions although they were also of variable ratios(54-70%for hyper-DMR and 77-83%for hypo-DMR,respectively;Figure S2).These results indicate biased distribution of mCGs in both Pt and Pe(enriched in TE regions and depleted in genic regions).Moreover,changes of mCG levels in the DMRs were apparent with developmental progression (phase 2>phase 1),which again mainly occurred in TE-enriched intergenic regions 3.2.Transcriptional Regulation of Gene Expression in the Two Mushroom Species Toinvestigate profiles of gene expression regulation in the two mushroom species(Pt and Pe). 4360 expres Materials and Me ods)were ide to c wo o or phe from n P t the th ()which is similar with previous studies in plant species 41.However.we note that the correlation of expression levels between the stages were significantly lower than those between biological replicates in each stages of the same species(Table S2),suggesting gene expression changes with development.Moreover,the correlations between gene expression decreased with progression of development. Genes 2019, 10, 465 5 of 14 Genes 2019, 10, x FOR PEER REVIEW 5 of 14 Figure 1. Landscape of DNA methylation in the two mushroom species, Pleurotus tuoliensis (designated Pt) and P. eryngii var. eryngii (designated Pe). (A) Distribution of DNA methylation levels of all covered CG sites (each having at least five reads) in all three tissues, mycelium, primordium and fruit body, in Pt and Pe. (B) Distribution of methylated CG sites (mCGs), in different categories of genomic features, intergenic, promoter, exon and down-1kb, in Pt and Pe. (C) Density of mCG levels among the three tissues belonging to different categories of genomic features in Pt and Pe. Dashed lines denote the average methylation levels of different genomic features in each species. We next investigated possible dynamics of mCG levels across the three developmental stages in both species. Differentially methylated regions (DMRs) were identified in both developmental transitions, transition 1 (from mycelium to primordium) and transition 2 (from primordium to fruit body). We found Pe possessed more DMRs than Pt in both transitions, although both mushrooms showed more DMRs in transition 1 than in transition 2 (Table S1; 180 versus 278 for Pt and 421 versus1428 for Pe; binomial test, p-values < 0.05). Intriguingly, the number of hyper-DMRs was more than that of hypo-DMRs in transition 2 in both mushrooms (binomial test, p-value < 0.05). For both hyper- and hypo-DMRs, intergenic regions possessed the highest proportions although they were also of variable ratios (54%–70% for hyper-DMR and 77%–83% for hypo-DMR, respectively; Figure S2). These results indicate biased distribution of mCGs in both Pt and Pe (enriched in TE regions and depleted in genic regions). Moreover, changes of mCG levels in the DMRs were apparent with developmental progression (phase 2 > phase 1), which again mainly occurred in TE-enriched intergenic regions. 3.2. Transcriptional Regulation of Gene Expression in the Two Mushroom Species To investigate profiles of gene expression regulation in the two mushroom species (Pt and Pe), 4360 expressed single-copy orthologs (Materials and Methods) were identified and used to compare expression changes at the two developmental transitions or phases (phase 1, from mycelium to primordium; phase 2, from primordium to fruitbody) in both species. As shown in Figure 2A, orthologs between the two species exhibited well-correlated patterns of gene expression at the three stages (Pearson r = 0.75–0.84), which is similar with previous studies in plant species [41]. However, we note that the correlation of expression levels between the stages were significantly lower than those between biological replicates in each stages of the same species (Table S2), suggesting gene expression changes with development. Moreover, the correlations between gene expression decreased with progression of development. Figure 1. Landscape of DNA methylation in the two mushroom species, Pleurotus tuoliensis (designated Pt) and P. eryngii var. eryngii (designated Pe). (A) Distribution of DNA methylation levels of all covered CG sites (each having at least five reads) in all three tissues, mycelium, primordium and fruit body, in Pt and Pe. (B) Distribution of methylated CG sites (mCGs), in different categories of genomic features, intergenic, promoter, exon and down-1kb, in Pt and Pe. (C) Density of mCG levels among the three tissues belonging to different categories of genomic features in Pt and Pe. Dashed lines denote the average methylation levels of different genomic features in each species. We next investigated possible dynamics of mCG levels across the three developmental stages in both species. Differentially methylated regions (DMRs) were identified in both developmental transitions, transition 1 (from mycelium to primordium) and transition 2 (from primordium to fruit body). We found Pe possessed more DMRs than Pt in both transitions, although both mushrooms showed more DMRs in transition 1 than in transition 2 (Table S1; 180 versus 278 for Pt and 421 versus1428 for Pe; binomial test, p-values < 0.05). Intriguingly, the number of hyper-DMRs was more than that of hypo-DMRs in transition 2 in both mushrooms (binomial test, p-value < 0.05). For both hyper- and hypo-DMRs, intergenic regions possessed the highest proportions although they were also of variable ratios (54–70% for hyper-DMR and 77–83% for hypo-DMR, respectively; Figure S2). These results indicate biased distribution of mCGs in both Pt and Pe (enriched in TE regions and depleted in genic regions). Moreover, changes of mCG levels in the DMRs were apparent with developmental progression (phase 2 > phase 1), which again mainly occurred in TE-enriched intergenic regions. 3.2. Transcriptional Regulation of Gene Expression in the Two Mushroom Species To investigate profiles of gene expression regulation in the two mushroom species (Pt and Pe), 4360 expressed single-copy orthologs (Materials and Methods) were identified and used to compare expression changes at the two developmental transitions or phases (phase 1, from mycelium to primordium; phase 2, from primordium to fruitbody) in both species. As shown in Figure 2A, orthologs between the two species exhibited well-correlated patterns of gene expression at the three stages (Pearson r = 0.75−0.84), which is similar with previous studies in plant species [41]. However, we note that the correlation of expression levels between the stages were significantly lower than those between biological replicates in each stages of the same species (Table S2), suggesting gene expression changes with development. Moreover, the correlations between gene expression decreased with progression of development