正在加载图片...
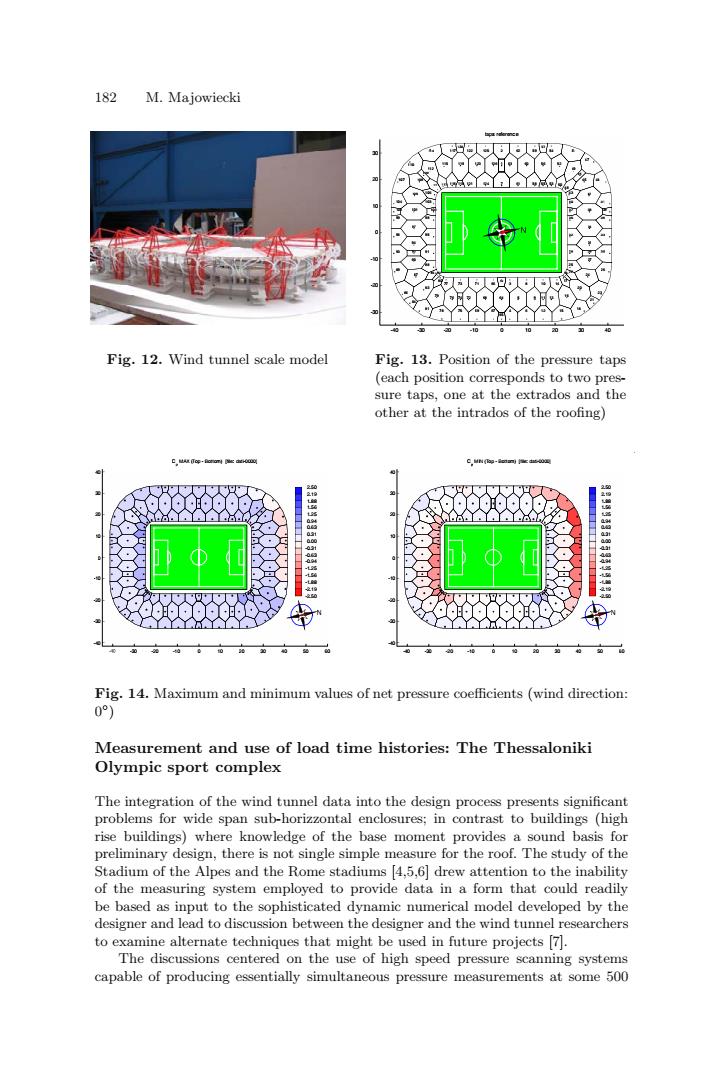
182 M.Majowiecki 10 Fig.12.Wind tunnel scale model Fig.13.Position of the pressure taps (each position corresponds to two pres- sure taps,one at the extrados and the other at the intrados of the roofing) C,MN(-o)dio Fig.14.Maximum and minimum values of net pressure coefficients (wind direction: 0) Measurement and use of load time histories:The Thessaloniki Olympic sport complex The integration of the wind tunnel data into the design process presents significant problems for wide span sub-horizzontal enclosures;in contrast to buildings (high rise buildings)where knowledge of the base moment provides a sound basis for preliminary design,there is not single simple measure for the roof.The study of the Stadium of the Alpes and the Rome stadiums [4.5,6]drew attention to the inability of the measuring system employed to provide data in a form that could readily be based as input to the sophisticated dynamic numerical model developed by the designer and lead to discussion between the designer and the wind tunnel researchers to examine alternate techniques that might be used in future projects [7]. The discussions centered on the use of high speed pressure scanning systems capable of producing essentially simultaneous pressure measurements at some 500182 M. Majowiecki Fig. 12. Wind tunnel scale model Fig. 13. Position of the pressure taps (each position corresponds to two pressure taps, one at the extrados and the other at the intrados of the roofing) Fig. 14. Maximum and minimum values of net pressure coefficients (wind direction: 0◦) Measurement and use of load time histories: The Thessaloniki Olympic sport complex The integration of the wind tunnel data into the design process presents significant problems for wide span sub-horizzontal enclosures; in contrast to buildings (high rise buildings) where knowledge of the base moment provides a sound basis for preliminary design, there is not single simple measure for the roof. The study of the Stadium of the Alpes and the Rome stadiums [4,5,6] drew attention to the inability of the measuring system employed to provide data in a form that could readily be based as input to the sophisticated dynamic numerical model developed by the designer and lead to discussion between the designer and the wind tunnel researchers to examine alternate techniques that might be used in future projects [7]. The discussions centered on the use of high speed pressure scanning systems capable of producing essentially simultaneous pressure measurements at some 500 -40 -30 -20 -10 0 10 20 30 40 -30 -20 -10 0 10 20 30 taps reference 1 2 3 4 5 6 7 8 9 10 11 12 13 14 15 16 17 18 19 20 21 22 23 24 25 26 27 28 29 30 31 32 33 34 35 36 37 38 39 40 41 42 43 45 44 46 47 48 49 50 51 52 53 54 55 56 57 58 59 60 61 62 63 64 65 66 67 68 69 70 71 72 73 74 75 76 77 78 79 80 81 82 83 84 85 86 87 88 89 90 93 92 91 94 96 95 97 99 98 102 101 100 104 103 105 106 107 108 109 110 111 112 113 114 115 116 117 118 119 120 121 122 123 124 125 126 -40 -30 -20 -10 0 10 20 30 40 50 60 -40 -30 -20 -10 0 10 20 30 40 Cp MIN (Top - Bottom) [file: dati-0000] -2.50 -2.19 -1.88 -1.56 -1.25 -0.94 -0.63 -0.31 0.00 0.31 0.63 0.94 1.25 1.56 1.88 2.19 2.50 N -30 -20 -10 0 10 20 30 40 50 60 -40 -30 -20 -10 0 10 20 30 40 Cp MAX (Top - Bottom) [file: dati-0000] -2.50 -2.19 -1.88 -1.56 -1.25 -0.94 -0.63 -0.31 0.00 0.31 0.63 0.94 1.25 1.56 1.88 2.19 2.50 N