正在加载图片...
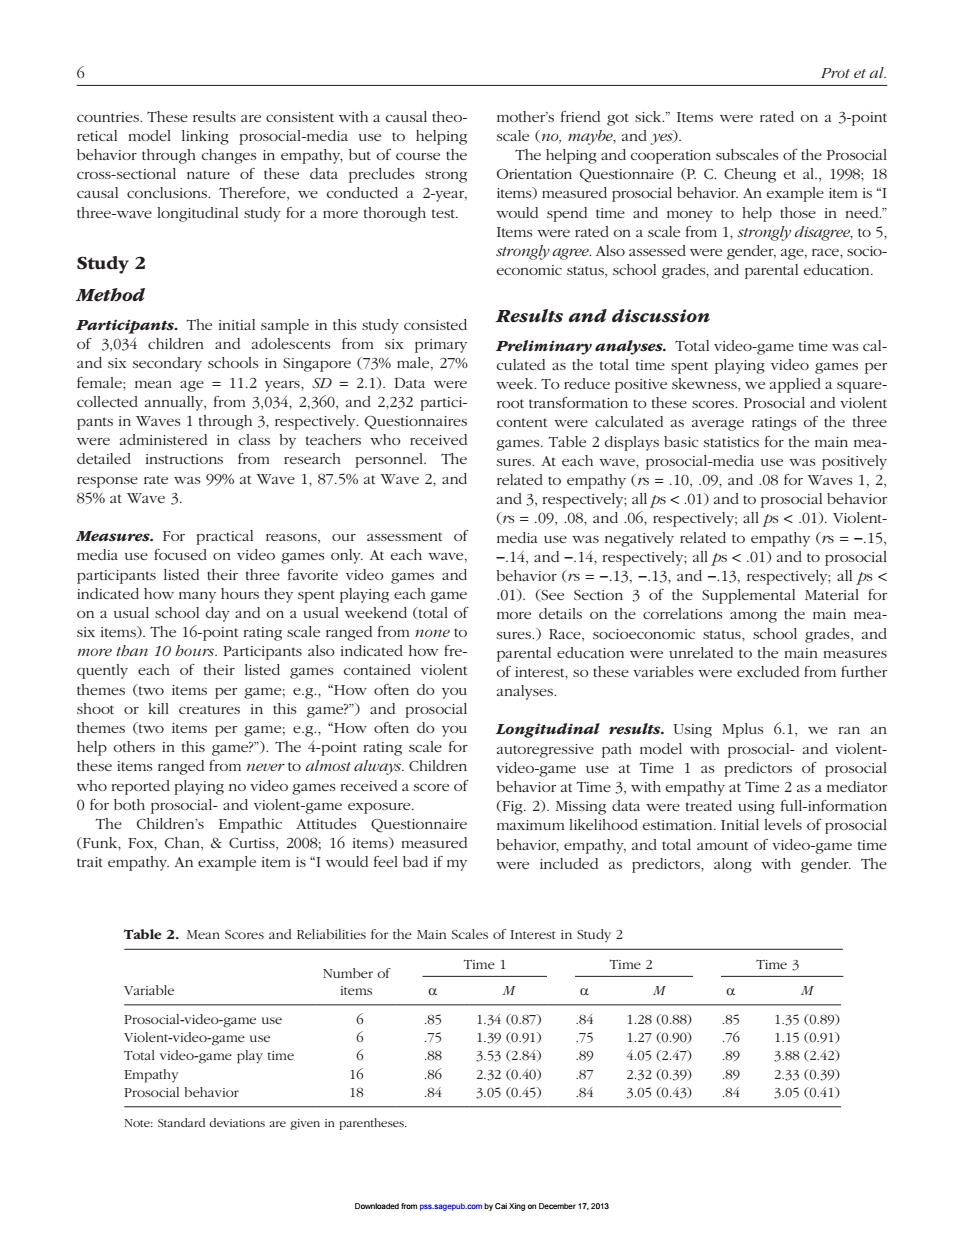
6 Prot et al. countries.These results are consistent with a causal theo- mother's friend got sick."Items were rated on a 3-point retical model linking prosocial-media use to helping scale (no,maybe,and yes). behavior through changes empathy,but of the The helping and cooperation subscales of th e Prosocial would spend time and money to help those in need." Items were rated on a scale from 1,strongly disagree,to5 Study 2 Method Partciaaid Results and discussion Toaliteoamme2d female:mean age 112e sD =2.1).Data were ek To red collected annually,from 3,034,2.360,and 2,232 partici- root transformation to these scores.Prosocial and violent pants in Wave ely. who ionnaire content were calculated as average ratings of the three istere games 2dsplaysbasicstaitcsfortemnn sponse rate was 99%at Wave 1.87.5%at Wave 2.and 10 09 and 08 for wave 1 85%at Wave 3. and 3.respectively:all ps<01)and to prosocial behavior (rs =09,.08,and .06,respectively;all ps <01).Violent Meas For reasons,o media use wa s negatively relat ed to participants listed their three favorite video nes and indicated how many hours they spent playing each game .01).(See Section 3 of the Supplemental Material for on a usual s chool day and on a usual wee kend (total of more details on the correlations among the main mea cdhat sures.Race,socioeconomic sta school grades,and quently each of their listed games contained violent parental ton we were e themes (two items per game:e.g.,"How often do you analyses. shoot or kill creatures in this game?)and prosocial tems per gam 8, Longitudinal results 1,we ran an path mod pro who reported playing no video games received a score of behavior at Time3.with empathy at Time 2 as a mediator 0 for both prosocial-and violent-game exposure. (Fig.2).Missing data were treated using full-information mpathic Questionnair els of prosocia trait empathy.An example item is"I would feel bad if my Table 2.Mean Scores and Reliabilities for the Main Scales of Interest in Study 2 Nur r of Time 1 Time 2 Time 3 Variable Prosocial-video-game use 1.34(0.87) 1.28(0.88) 1.35(0.89 4.05247 Empathy 16 2.32(0.40 2.32(0.39 233030 Prosocial behavior 18 84 3.05(0.45) 84 3.05(0.43) 84 3.05(0.41 2016 Prot et al. countries. These results are consistent with a causal theoretical model linking prosocial-media use to helping behavior through changes in empathy, but of course the cross-sectional nature of these data precludes strong causal conclusions. Therefore, we conducted a 2-year, three-wave longitudinal study for a more thorough test. Study 2 Method Participants. The initial sample in this study consisted of 3,034 children and adolescents from six primary and six secondary schools in Singapore (73% male, 27% female; mean age = 11.2 years, SD = 2.1). Data were collected annually, from 3,034, 2,360, and 2,232 participants in Waves 1 through 3, respectively. Questionnaires were administered in class by teachers who received detailed instructions from research personnel. The response rate was 99% at Wave 1, 87.5% at Wave 2, and 85% at Wave 3. Measures. For practical reasons, our assessment of media use focused on video games only. At each wave, participants listed their three favorite video games and indicated how many hours they spent playing each game on a usual school day and on a usual weekend (total of six items). The 16-point rating scale ranged from none to more than 10 hours. Participants also indicated how frequently each of their listed games contained violent themes (two items per game; e.g., “How often do you shoot or kill creatures in this game?”) and prosocial themes (two items per game; e.g., “How often do you help others in this game?”). The 4-point rating scale for these items ranged from never to almost always. Children who reported playing no video games received a score of 0 for both prosocial- and violent-game exposure. The Children’s Empathic Attitudes Questionnaire (Funk, Fox, Chan, & Curtiss, 2008; 16 items) measured trait empathy. An example item is “I would feel bad if my mother’s friend got sick.” Items were rated on a 3-point scale (no, maybe, and yes). The helping and cooperation subscales of the Prosocial Orientation Questionnaire (P. C. Cheung et al., 1998; 18 items) measured prosocial behavior. An example item is “I would spend time and money to help those in need.” Items were rated on a scale from 1, strongly disagree, to 5, strongly agree. Also assessed were gender, age, race, socioeconomic status, school grades, and parental education. Results and discussion Preliminary analyses. Total video-game time was calculated as the total time spent playing video games per week. To reduce positive skewness, we applied a squareroot transformation to these scores. Prosocial and violent content were calculated as average ratings of the three games. Table 2 displays basic statistics for the main measures. At each wave, prosocial-media use was positively related to empathy (rs = .10, .09, and .08 for Waves 1, 2, and 3, respectively; all ps < .01) and to prosocial behavior (rs = .09, .08, and .06, respectively; all ps < .01). Violentmedia use was negatively related to empathy (rs = −.15, −.14, and −.14, respectively; all ps < .01) and to prosocial behavior (rs = −.13, −.13, and −.13, respectively; all ps < .01). (See Section 3 of the Supplemental Material for more details on the correlations among the main measures.) Race, socioeconomic status, school grades, and parental education were unrelated to the main measures of interest, so these variables were excluded from further analyses. Longitudinal results. Using Mplus 6.1, we ran an autoregressive path model with prosocial- and violentvideo-game use at Time 1 as predictors of prosocial behavior at Time 3, with empathy at Time 2 as a mediator (Fig. 2). Missing data were treated using full-information maximum likelihood estimation. Initial levels of prosocial behavior, empathy, and total amount of video-game time were included as predictors, along with gender. The Table 2. Mean Scores and Reliabilities for the Main Scales of Interest in Study 2 Number of items Time 1 Time 2 Time 3 Variable α M α M α M Prosocial-video-game use 6 .85 1.34 (0.87) .84 1.28 (0.88) .85 1.35 (0.89) Violent-video-game use 6 .75 1.39 (0.91) .75 1.27 (0.90) .76 1.15 (0.91) Total video-game play time 6 .88 3.53 (2.84) .89 4.05 (2.47) .89 3.88 (2.42) Empathy 16 .86 2.32 (0.40) .87 2.32 (0.39) .89 2.33 (0.39) Prosocial behavior 18 .84 3.05 (0.45) .84 3.05 (0.43) .84 3.05 (0.41) Note: Standard deviations are given in parentheses. Downloaded from pss.sagepub.com by Cai Xing on December 17, 2013