正在加载图片...
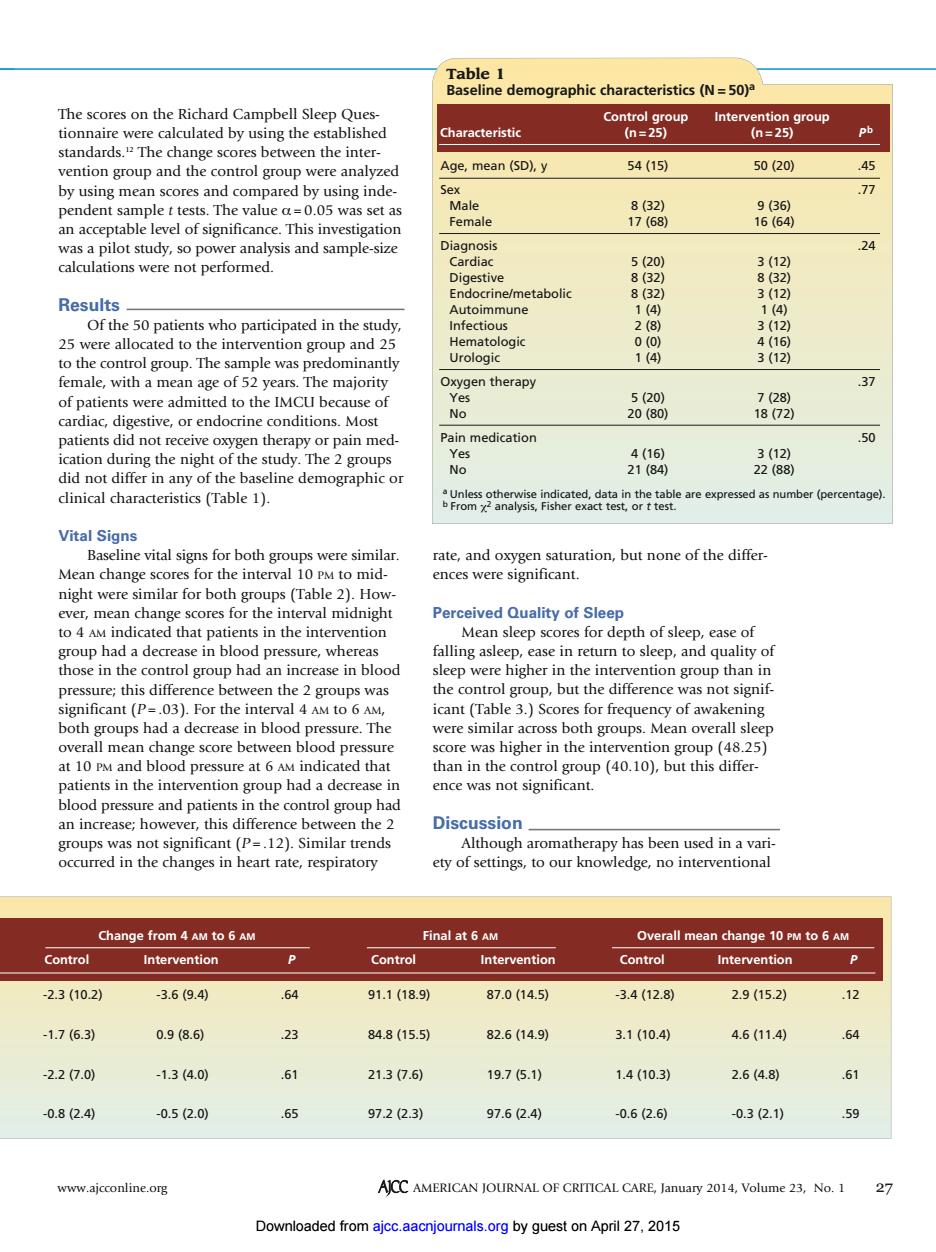
Table 1 Baseline demographic characteristics(N=50)a The scores on the Richard Campbell Sleep Ques- Control group Intervention group tionnaire were calculated by using the established Characteristic (n=25) (n=25) standards.The change scores between the inter- vention group and the control group were analyzed Age,mean (SD),y 54(15) 50(20) 45 by using mean scores and compared by using inde- Sex .77 pendent sample t tests.The value a=0.05 was set as Male 8(32) 9(36) an acceptable level of significance.This investigation Female 17(68) 16(64) was a pilot study,so power analysis and sample-size Diagnosis .24 calculations were not performed. Cardiac 5(20) 3(12) Digestive 8(32) 8(32) Endocrine/metabolic 8(32) 3(12) Results Autoimmune 1(4) 1(4) Of the 50 patients who participated in the study, Infectious 2(8) 3(12) 25 were allocated to the intervention group and 25 Hematologic 0(0) 4(16) to the control group.The sample was predominantly Urologic 1(4) 3(12) female,with a mean age of 52 years.The majority Oxygen therapy 37 of patients were admitted to the IMCU because of Yes 5(20) 7(28) cardiac,digestive,or endocrine conditions.Most No 20(80) 18(72) patients did not receive oxygen therapy or pain med- Pain medication .50 ication during the night of the study.The 2 groups Yes 4(16) 3(12) did not differ in any of the baseline demographic or No 21(84 22(88) clinical characteristics (Table 1). .Unless otherwise indicated,data in the table are expressed as number(percentage). bFrom x2 analysis,Fisher exact test,or t test. Vital Signs Baseline vital signs for both groups were similar. rate,and oxygen saturation,but none of the differ- Mean change scores for the interval 10 PM to mid- ences were significant. night were similar for both groups(Table 2).How- ever,mean change scores for the interval midnight Perceived Quality of Sleep to 4 AM indicated that patients in the intervention Mean sleep scores for depth of sleep,ease of group had a decrease in blood pressure,whereas falling asleep,ease in return to sleep,and quality of those in the control group had an increase in blood sleep were higher in the intervention group than in pressure;this difference between the 2 groups was the control group,but the difference was not signif- significant(P=.03).For the interval 4 AM to 6 AM, icant(Table 3.)Scores for frequency of awakening both groups had a decrease in blood pressure.The were similar across both groups.Mean overall sleep overall mean change score between blood pressure score was higher in the intervention group(48.25) at 10 PM and blood pressure at 6 AM indicated that than in the control group (40.10),but this differ- patients in the intervention group had a decrease in ence was not significant. blood pressure and patients in the control group had an increase;however,this difference between the 2 Discussion_ groups was not significant(P=.12).Similar trends Although aromatherapy has been used in a vari- occurred in the changes in heart rate,respiratory ety of settings,to our knowledge,no interventional Change from 4 AM to 6 AM Final at 6 AM Overall mean change 10 PM to 6 AM Control Intervention Control Intervention Control Intervention -2.3(10.2) -3.6(9.4) .64 91.1(18.9) 87.0(14.5) -3.4(12.8) 2.9(15.2) .12 -1.7(6.3) 0.9(8.6) 23 84.8(15.5) 82.6(14.9) 3.1(10.4) 4.6(11.4) .64 -2.2(7.0) -1.3(4.0) .61 21.3(7.6) 19.7(5.1) 1.4(10.3) 2.6(4.8) .61 -0.8(2.4) -0.5(2.0) 65 97.2(2.3) 97.6(2.4) -0.6(2.6) -0.3(2.1) .59 www.ajcconline.org AJCC AMERICAN JOURNAL OF CRITICAL CARE,January 2014,Volume 23,No.1 27 Downloaded from ajcc.aacnjournals.org by guest on April 27,2015Table 1 Baseline demographic characteristics (N = 50)a 54 (15) 8 (32) 17 (68) 5 (20) 8 (32) 8 (32) 1 (4) 2 (8) 0 (0) 1 (4) 5 (20) 20 (80) 4 (16) 21 (84) 50 (20) 9 (36) 16 (64) 3 (12) 8 (32) 3 (12) 1 (4) 3 (12) 4 (16) 3 (12) 7 (28) 18 (72) 3 (12) 22 (88) .45 .77 .24 .37 .50 Age, mean (SD), y Sex Male Female Diagnosis Cardiac Digestive Endocrine/metabolic Autoimmune Infectious Hematologic Urologic Oxygen therapy Yes No Pain medication Yes No a Unless otherwise indicated, data in the table are expressed as number (percentage). b From χ2 analysis, Fisher exact test, or t test. Intervention group (n = 25) Control group Characteristic (n = 25) Pb Change from 4 AM to 6 AM Final at 6 AM Overall mean change 10 PM to 6 AM Control Intervention P Control Intervention Control Intervention P -2.3 (10.2) -1.7 (6.3) -2.2 (7.0) -0.8 (2.4) -3.6 (9.4) 0.9 (8.6) -1.3 (4.0) -0.5 (2.0) .64 .23 .61 .65 91.1 (18.9) 84.8 (15.5) 21.3 (7.6) 97.2 (2.3) 87.0 (14.5) 82.6 (14.9) 19.7 (5.1) 97.6 (2.4) -3.4 (12.8) 3.1 (10.4) 1.4 (10.3) -0.6 (2.6) 2.9 (15.2) 4.6 (11.4) 2.6 (4.8) -0.3 (2.1) .12 .64 .61 .59 www.ajcconline.org AJCC AMERICAN JOURNAL OF CRITICAL CARE, January 2014, Volume 23, No. 1 27 The scores on the Richard Campbell Sleep Questionnaire were calculated by using the established standards.12 The change scores between the intervention group and the control group were analyzed by using mean scores and compared by using independent sample t tests. The value α= 0.05 was set as an acceptable level of significance. This investigation was a pilot study, so power analysis and sample-size calculations were not performed. Results Of the 50 patients who participated in the study, 25 were allocated to the intervention group and 25 to the control group. The sample was predominantly female, with a mean age of 52 years. The majority of patients were admitted to the IMCU because of cardiac, digestive, or endocrine conditions. Most patients did not receive oxygen therapy or pain medication during the night of the study. The 2 groups did not differ in any of the baseline demographic or clinical characteristics (Table 1). Vital Signs Baseline vital signs for both groups were similar. Mean change scores for the interval 10 PM to midnight were similar for both groups (Table 2). However, mean change scores for the interval midnight to 4 AM indicated that patients in the intervention group had a decrease in blood pressure, whereas those in the control group had an increase in blood pressure; this difference between the 2 groups was significant (P = .03). For the interval 4 AM to 6 AM, both groups had a decrease in blood pressure. The overall mean change score between blood pressure at 10 PM and blood pressure at 6 AM indicated that patients in the intervention group had a decrease in blood pressure and patients in the control group had an increase; however, this difference between the 2 groups was not significant (P = .12). Similar trends occurred in the changes in heart rate, respiratory rate, and oxygen saturation, but none of the differences were significant. Perceived Quality of Sleep Mean sleep scores for depth of sleep, ease of falling asleep, ease in return to sleep, and quality of sleep were higher in the intervention group than in the control group, but the difference was not significant (Table 3 .) Scores for frequency of awakening were similar across both groups. Mean overall sleep score was higher in the intervention group (48.25) than in the control group (40.10), but this difference was not significant. Discussion Although aromatherapy has been used in a variety of settings, to our knowledge, no interventional Downloaded from ajcc.aacnjournals.org by guest on April 27, 2015