正在加载图片...

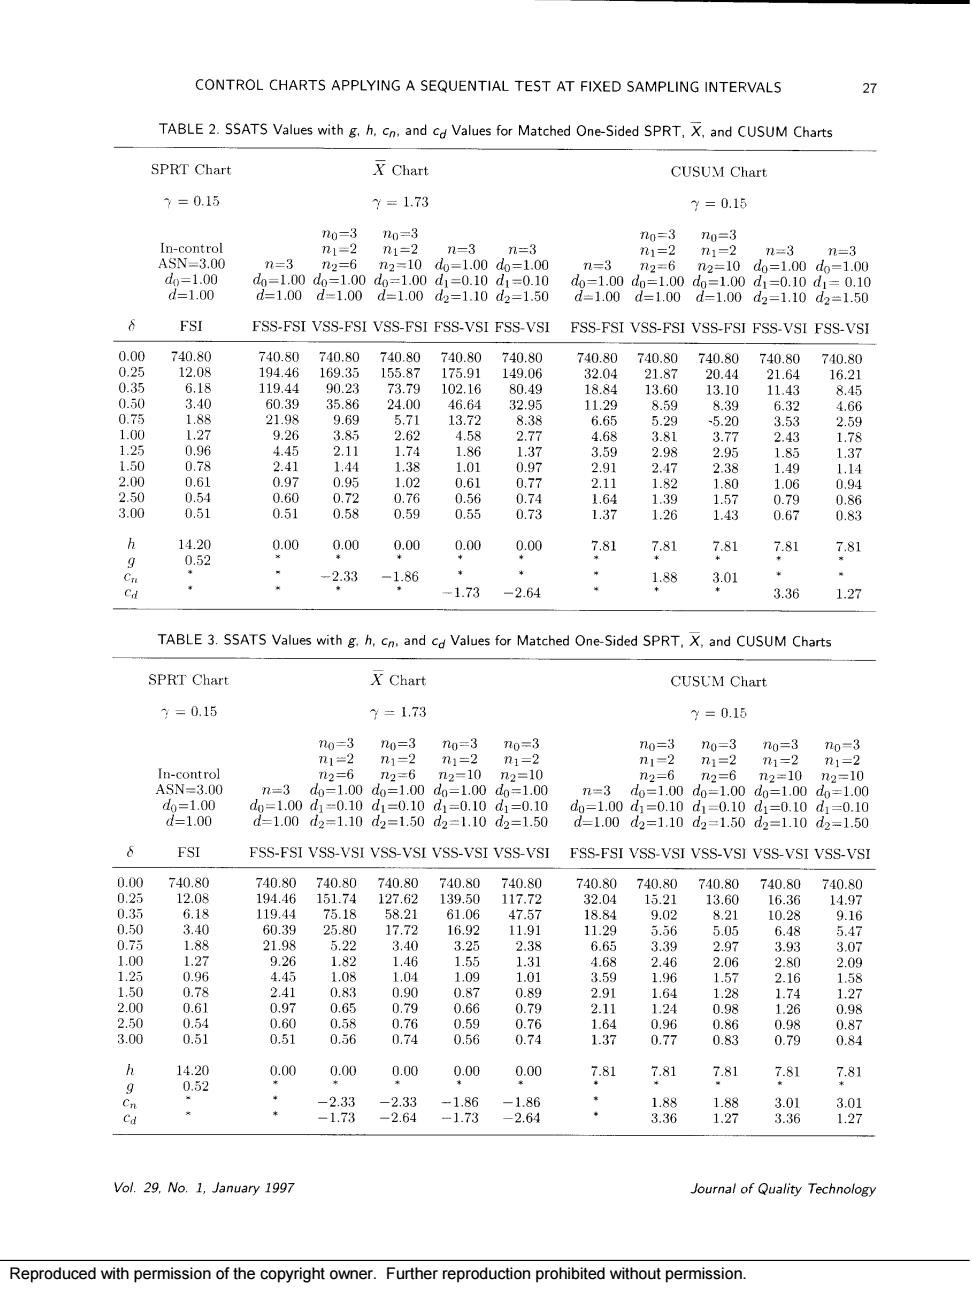
CONTROL CHARTS APPLYING A SEQUENTIAL TEST AT FIXED SAMPLING INTERVALS TABLE 2.SSATS Values with g.h.co.and c Values for Matched One-Sided SPRT X and CUSUM Charts SPRT Char Chart CUSUM Chart =0.15 y=1.73 y=0.15 no-3 nomtTo 1-2 1=3 品 d-1.00 d=1.00d=i.00d=1.00d2110d2=150 FSI FSS-FSI VSS-FSIVSS-FSI FSS-VSI FSS-VSI FSS-FSI VSS-FSI VSS-FSI FSS-VSI FSS-VSI 829 7980 7408 740.80 740.80 162 24.0 21.9 2 -5 9 26 .3 30 97 23 05 0.59 8 器 0.00 0.00 0.00 00 781 7.81 7.81 781 7.81 -2.33 -1.86 1.88 3.01 1.73 2.64 3.36 1.27 TABLE 3.S5AT5 Values with g.h,cn.and cd Values for Matched One-Sided SPRT,X.and CUSUM Charts SPRT Chart XChar CUSUM Chart =0.15 =1.73 =015 w-d 100 6 FSI FSS-FSI VSS-VSI VSS-VSIVSS-VSI VSS-VSI FSS-FSI VSS-VSI VSS-VSI VSS-VSI VSS-VS 器 740.89 19 721 71830 2.97 898 1.04 .0 052 169 0.00 0.00 0.00 0.00 0.00 7.81 7.81 7.81 781 Vol.29.No.1,January 1997 Journal of Quality Technology Reproduced with permission of the copyright owner.Further reproduction prohibited without permission.Reproduced with permission of the copyright owner. Further reproduction prohibited without permission