正在加载图片...
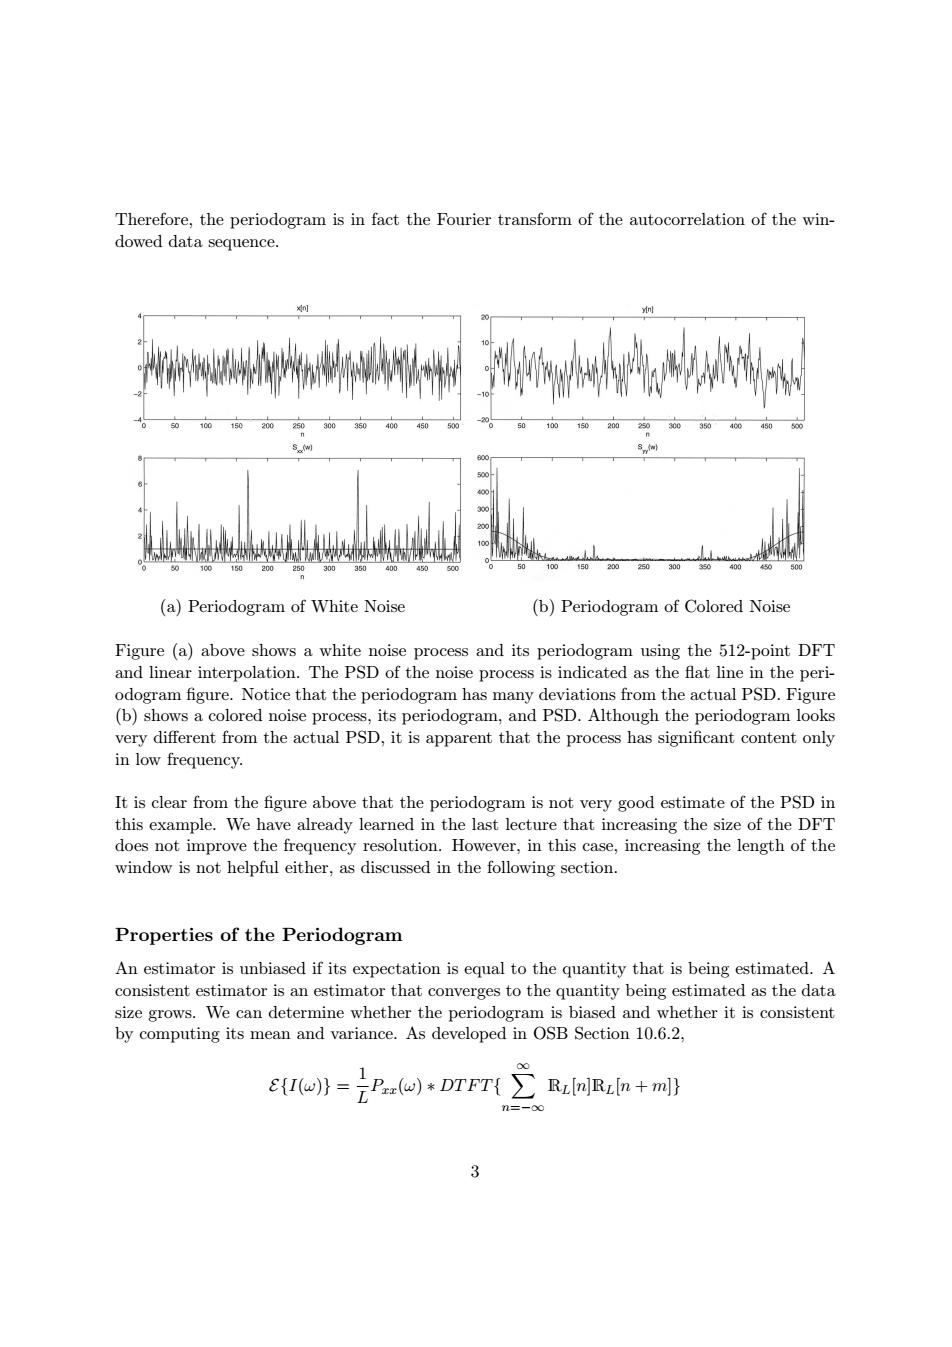
Therefore,the periodogram is in fact the Fourier transform of the autocorrelation of the win- dowed data sequence. 4 150 200 260 300350 400 00 100 15020025030030 400 (a)Periodogram of White Noise (b)Periodogram of Colored Noise Figure(a)above shows a white noise process and its periodogram using the 512-point DFT and linear interpolation.The PSD of the noise process is indicated as the flat line in the peri- odogram figure.Notice that the periodogram has many deviations from the actual PSD.Figure (b)shows a colored noise process,its periodogram,and PSD.Although the periodogram looks very different from the actual PSD,it is apparent that the process has significant content only in low frequency. It is clear from the figure above that the periodogram is not very good estimate of the PSD in this example.We have already learned in the last lecture that increasing the size of the DFT does not improve the frequency resolution.However,in this case,increasing the length of the window is not helpful either,as discussed in the following section. Properties of the Periodogram An estimator is unbiased if its expectation is equal to the quantity that is being estimated.A consistent estimator is an estimator that converges to the quantity being estimated as the data size grows.We can determine whether the periodogram is biased and whether it is consistent by computing its mean and variance.As developed in OSB Section 10.6.2, ())DFT 3Therefore, the periodogram is in fact the Fourier transform of the autocorrelation of the windowed data sequence. (a) Periodogram of White Noise (b) Periodogram of Colored Noise Figure (a) above shows a white noise process and its periodogram using the 512-point DFT and linear interpolation. The PSD of the noise process is indicated as the flat line in the periodogram figure. Notice that the periodogram has many deviations from the actual PSD. Figure (b) shows a colored noise process, its periodogram, and PSD. Although the periodogram looks very different from the actual PSD, it is apparent that the process has significant content only in low frequency. It is clear from the figure above that the periodogram is not very good estimate of the PSD in this example. We have already learned in the last lecture that increasing the size of the DFT does not improve the frequency resolution. However, in this case, increasing the length of the window is not helpful either, as discussed in the following section. Properties of the Periodogram An estimator is unbiased if its expectation is equal to the quantity that is being estimated. A consistent estimator is an estimator that converges to the quantity being estimated as the data size grows. We can determine whether the periodogram is biased and whether it is consistent by computing its mean and variance. As developed in OSB Section 10.6.2, 1 ∞ Pxx(ω) ∗ DT F T{ � E{I(ω)} = RL[n]RL[n + m] L n= } −∞ 3