正在加载图片...

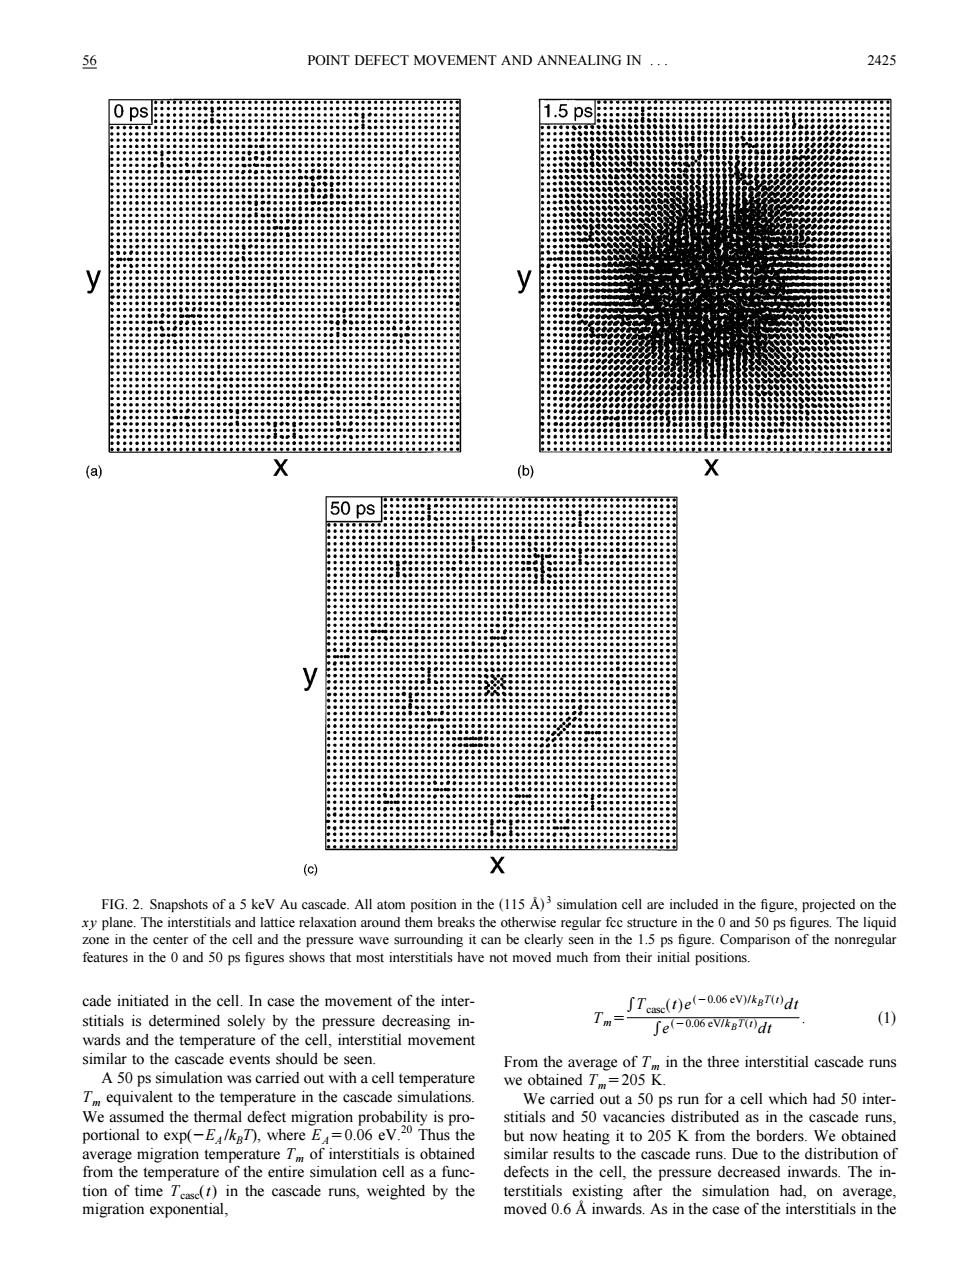
56 POINT DEFECT MOVEMENT AND ANNEALING IN .. 2425 0ps 1.5ps (a) (b) 50 ps (c) FIG.2.Snapshots of a 5 keV Au cascade.All atom position in the (115 A)3 simulation cell are included in the figure,projected on the xy plane.The interstitials and lattice relaxation around them breaks the otherwise regular fec structure in the 0 and 50 ps figures.The liquid zone in the center of the cell and the pressure wave surrounding it can be clearly seen in the 1.5 ps figure.Comparison of the nonregular features in the 0 and 50 ps figures shows that most interstitials have not moved much from their initial positions cade initiated in the cell.In case the movement of the inter- Tcase(t)e(-006eV)kgT(dt stitials is determined solely by the pressure decreasing in- Tm= Te(-0.06eVIkBT(dt (1)) wards and the temperature of the cell,interstitial movement similar to the cascade events should be seen From the average of T in the three interstitial cascade runs A 50 ps simulation was carried out with a cell temperature we obtained T =205 K. T equivalent to the temperature in the cascade simulations. We carried out a 50 ps run for a cell which had 50 inter- We assumed the thermal defect migration probability is pro- stitials and 50 vacancies distributed as in the cascade runs. portional to exp(-E/kgT),where E=0.06 eV.20 Thus the but now heating it to 205 K from the borders.We obtained average migration temperature Tm of interstitials is obtained similar results to the cascade runs.Due to the distribution of from the temperature of the entire simulation cell as a func- defects in the cell,the pressure decreased inwards.The in- tion of time Tease(1)in the cascade runs,weighted by the terstitials existing after the simulation had,on average, migration exponential. moved 0.6 A inwards.As in the case of the interstitials in thecade initiated in the cell. In case the movement of the interstitials is determined solely by the pressure decreasing inwards and the temperature of the cell, interstitial movement similar to the cascade events should be seen. A 50 ps simulation was carried out with a cell temperature Tm equivalent to the temperature in the cascade simulations. We assumed the thermal defect migration probability is proportional to exp(2EA /kBT), where EA50.06 eV.20 Thus the average migration temperature Tm of interstitials is obtained from the temperature of the entire simulation cell as a function of time Tcasc(t) in the cascade runs, weighted by the migration exponential, Tm5*Tcasc~t!e~20.06 eV!/kBT~t! dt *e~20.06 eV/kBT~t! dt . ~1! From the average of Tm in the three interstitial cascade runs we obtained Tm5205 K. We carried out a 50 ps run for a cell which had 50 interstitials and 50 vacancies distributed as in the cascade runs, but now heating it to 205 K from the borders. We obtained similar results to the cascade runs. Due to the distribution of defects in the cell, the pressure decreased inwards. The interstitials existing after the simulation had, on average, moved 0.6 Å inwards. As in the case of the interstitials in the FIG. 2. Snapshots of a 5 keV Au cascade. All atom position in the ~115 Å! 3 simulation cell are included in the figure, projected on the xy plane. The interstitials and lattice relaxation around them breaks the otherwise regular fcc structure in the 0 and 50 ps figures. The liquid zone in the center of the cell and the pressure wave surrounding it can be clearly seen in the 1.5 ps figure. Comparison of the nonregular features in the 0 and 50 ps figures shows that most interstitials have not moved much from their initial positions. 56 POINT DEFECT MOVEMENT AND ANNEALING IN . . . 2425