正在加载图片...

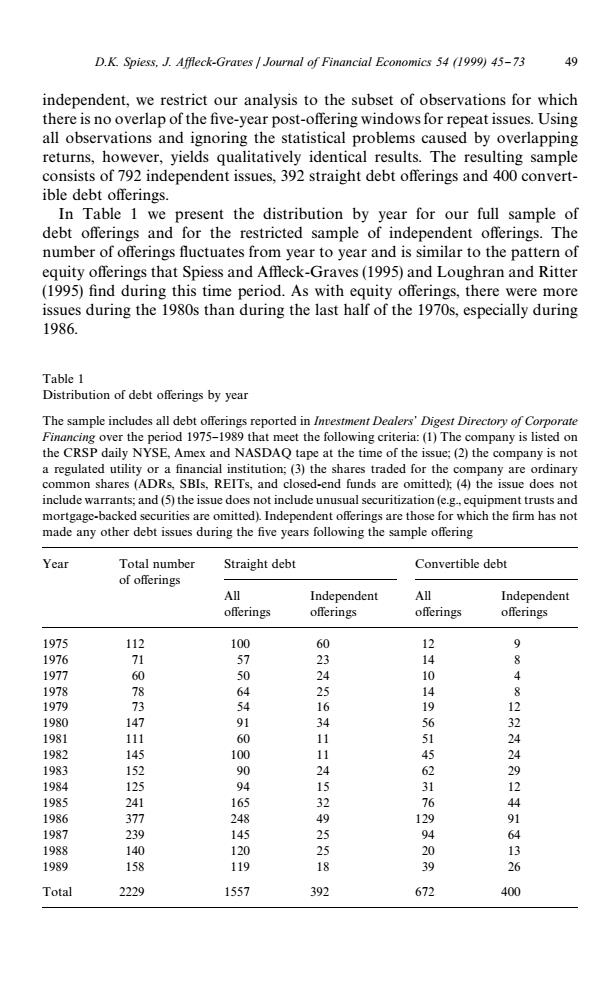
D.K.Spiess,J.Affleck-Graves Journal of Financial Economics 54 (1999)45-73 49 independent,we restrict our analysis to the subset of observations for which there is no overlap of the five-year post-offering windows for repeat issues.Using all observations and ignoring the statistical problems caused by overlapping returns,however,yields qualitatively identical results.The resulting sample consists of 792 independent issues,392 straight debt offerings and 400 convert- ible debt offerings. In Table 1 we present the distribution by year for our full sample of debt offerings and for the restricted sample of independent offerings.The number of offerings fluctuates from year to year and is similar to the pattern of equity offerings that Spiess and Affleck-Graves(1995)and Loughran and Ritter (1995)find during this time period.As with equity offerings,there were more issues during the 1980s than during the last half of the 1970s,especially during 1986. Table 1 Distribution of debt offerings by year The sample includes all debt offerings reported in Investment Dealers'Digest Directory of Corporate Financing over the period 1975-1989 that meet the following criteria:(1)The company is listed on the CRSP daily NYSE,Amex and NASDAQ tape at the time of the issue;(2)the company is not a regulated utility or a financial institution;(3)the shares traded for the company are ordinary common shares (ADRs,SBIs,REITs,and closed-end funds are omitted;(4)the issue does not include warrants;and(5)the issue does not include unusual securitization(e.g,equipment trusts and mortgage-backed securities are omitted).Independent offerings are those for which the firm has not made any other debt issues during the five years following the sample offering Year Total number Straight debt Convertible debt of offerings All Independent All Independent offerings offerings offerings offerings 1975 112 100 60 12 9 1976 71 57 23 14 1977 60 50 24 10 4 1978 1979 83 64 516 14 12 1980 91 1981 111 60 11 1961 24 1982 145 100 24 1983 152 90 2 29 1984 125 94 12 1985 241 165 32 1 4 1986 377 248 1987 239 145 92 129 91 1988 140 120 25 20 13 1989 158 119 1 3 Total 2229 1557 392 672 400Table 1 Distribution of debt o!erings by year The sample includes all debt o!erings reported in Investment Dealers+ Digest Directory of Corporate Financing over the period 1975}1989 that meet the following criteria: (1) The company is listed on the CRSP daily NYSE, Amex and NASDAQ tape at the time of the issue; (2) the company is not a regulated utility or a "nancial institution; (3) the shares traded for the company are ordinary common shares (ADRs, SBIs, REITs, and closed-end funds are omitted); (4) the issue does not include warrants; and (5) the issue does not include unusual securitization (e.g., equipment trusts and mortgage-backed securities are omitted). Independent o!erings are those for which the "rm has not made any other debt issues during the "ve years following the sample o!ering Year Total number Straight debt Convertible debt of o!erings All o!erings Independent o!erings All o!erings Independent o!erings 1975 112 100 60 12 9 1976 71 57 23 14 8 1977 60 50 24 10 4 1978 78 64 25 14 8 1979 73 54 16 19 12 1980 147 91 34 56 32 1981 111 60 11 51 24 1982 145 100 11 45 24 1983 152 90 24 62 29 1984 125 94 15 31 12 1985 241 165 32 76 44 1986 377 248 49 129 91 1987 239 145 25 94 64 1988 140 120 25 20 13 1989 158 119 18 39 26 Total 2229 1557 392 672 400 independent, we restrict our analysis to the subset of observations for which there is no overlap of the "ve-year post-o!ering windows for repeat issues. Using all observations and ignoring the statistical problems caused by overlapping returns, however, yields qualitatively identical results. The resulting sample consists of 792 independent issues, 392 straight debt o!erings and 400 convertible debt o!erings. In Table 1 we present the distribution by year for our full sample of debt o!erings and for the restricted sample of independent o!erings. The number of o!erings #uctuates from year to year and is similar to the pattern of equity o!erings that Spiess and A%eck-Graves (1995) and Loughran and Ritter (1995) "nd during this time period. As with equity o!erings, there were more issues during the 1980s than during the last half of the 1970s, especially during 1986. D.K. Spiess, J. A{eck-Graves / Journal of Financial Economics 54 (1999) 45}73 49