正在加载图片...

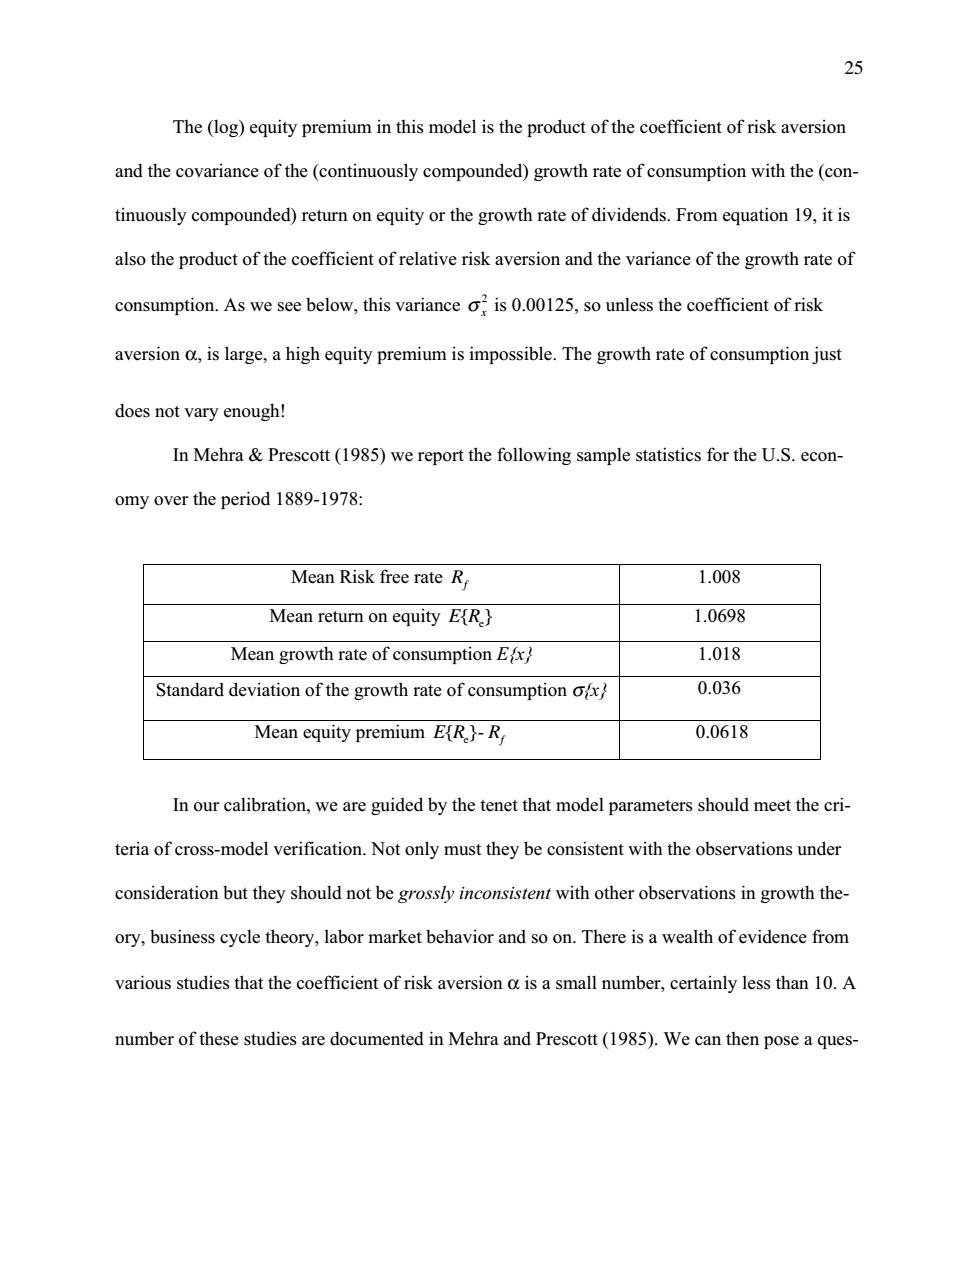
25 The (log)equity premium in this model is the product of the coefficient of risk aversion and the covariance of the(continuously compounded)growth rate of consumption with the(con- tinuously compounded)return on equity or the growth rate of dividends.From equation 19,it is also the product of the coefficient of relative risk aversion and the variance of the growth rate of consumption.As we see below,this variance o:is 0.00125,so unless the coefficient of risk aversion d,is large,a high equity premium is impossible.The growth rate of consumption just does not vary enough! In Mehra Prescott(1985)we report the following sample statistics for the U.S.econ- omy over the period 1889-1978: Mean Risk free rate R 1.008 Mean return on equity E(R.} 1.0698 Mean growth rate of consumption Ex 1.018 Standard deviation of the growth rate of consumption ofx 0.036 Mean equity premium E(R.}-R 0.0618 In our calibration,we are guided by the tenet that model parameters should meet the cri- teria of cross-model verification.Not only must they be consistent with the observations under consideration but they should not be grossly inconsistent with other observations in growth the- ory,business cycle theory,labor market behavior and so on.There is a wealth of evidence from various studies that the coefficient of risk aversion o is a small number,certainly less than 10.A number of these studies are documented in Mehra and Prescott(1985).We can then pose a ques-25 The (log) equity premium in this model is the product of the coefficient of risk aversion and the covariance of the (continuously compounded) growth rate of consumption with the (continuously compounded) return on equity or the growth rate of dividends. From equation 19, it is also the product of the coefficient of relative risk aversion and the variance of the growth rate of consumption. As we see below, this variance s x 2 is 0.00125, so unless the coefficient of risk aversion a, is large, a high equity premium is impossible. The growth rate of consumption just does not vary enough! In Mehra & Prescott (1985) we report the following sample statistics for the U.S. economy over the period 1889-1978: Mean Risk free rate Rf 1.008 Mean return on equity E R{ }e 1.0698 Mean growth rate of consumption E{x} 1.018 Standard deviation of the growth rate of consumption s{x} 0.036 Mean equity premium E R{ }e - Rf 0.0618 In our calibration, we are guided by the tenet that model parameters should meet the criteria of cross-model verification. Not only must they be consistent with the observations under consideration but they should not be grossly inconsistent with other observations in growth theory, business cycle theory, labor market behavior and so on. There is a wealth of evidence from various studies that the coefficient of risk aversion a is a small number, certainly less than 10. A number of these studies are documented in Mehra and Prescott (1985). We can then pose a ques-