正在加载图片...
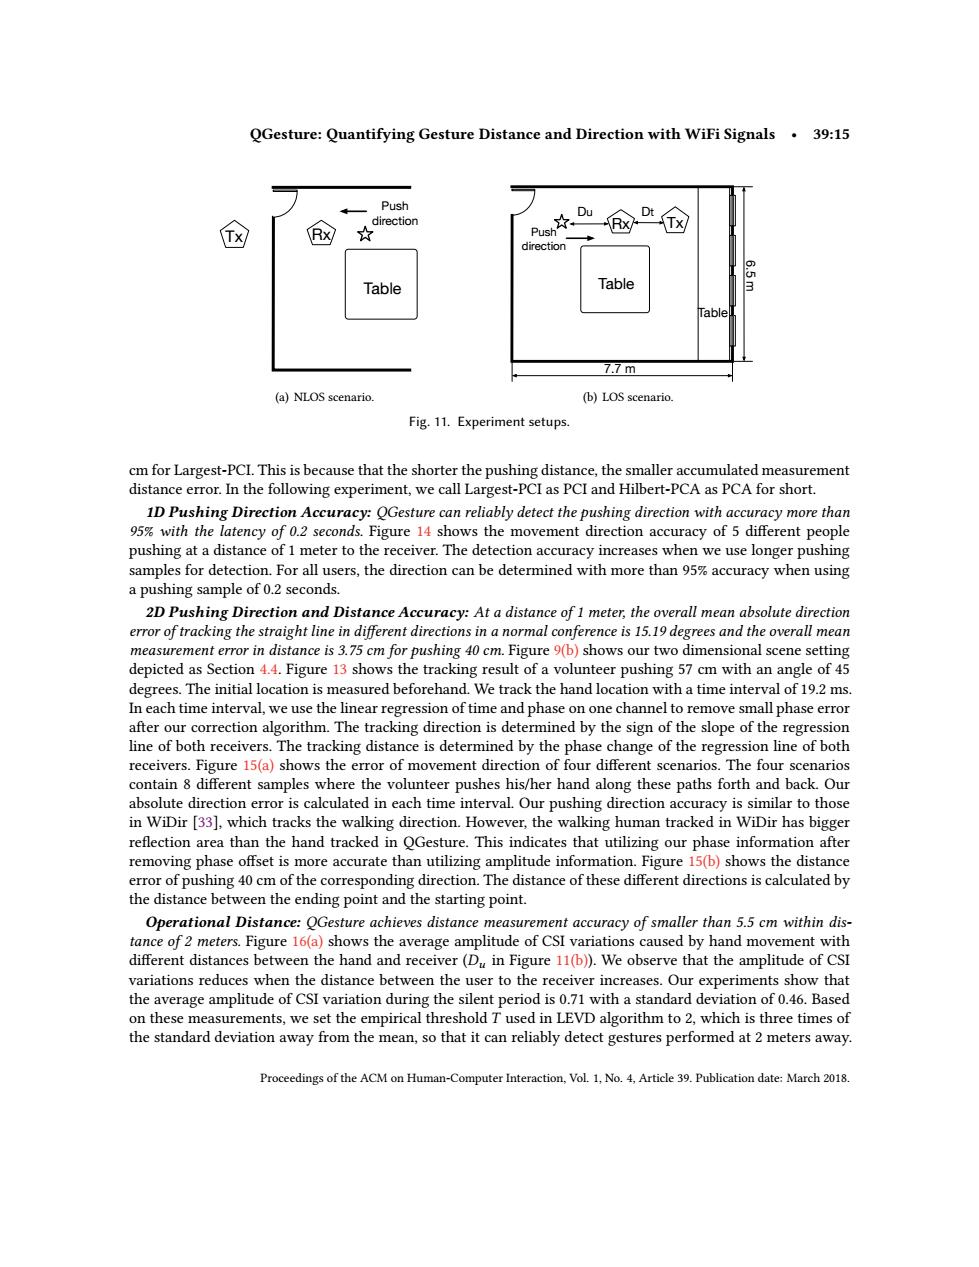
QGesture:Quantifying Gesture Distance and Direction with WiFi Signals.39:15 Push ☆ Du irection Tx ☆ Push direction Table Table ◇ Table 7.7m (a)NLOS scenario. (b)LOS scenario. Fig.11.Experiment setups. cm for Largest-PCI.This is because that the shorter the pushing distance,the smaller accumulated measurement distance error.In the following experiment,we call Largest-PCI as PCI and Hilbert-PCA as PCA for short. 1D Pushing Direction Accuracy:QGesture can reliably detect the pushing direction with accuracy more than 95%with the latency of 0.2 seconds.Figure 14 shows the movement direction accuracy of 5 different people pushing at a distance of 1 meter to the receiver.The detection accuracy increases when we use longer pushing samples for detection.For all users,the direction can be determined with more than 95%accuracy when using a pushing sample of 0.2 seconds. 2D Pushing Direction and Distance Accuracy:At a distance of 1 meter,the overall mean absolute direction error of tracking the straight line in different directions in a normal conference is 15.19 degrees and the overall mean measurement error in distance is 3.75 cm for pushing 40 cm.Figure 9(b)shows our two dimensional scene setting depicted as Section 4.4.Figure 13 shows the tracking result of a volunteer pushing 57 cm with an angle of 45 degrees.The initial location is measured beforehand.We track the hand location with a time interval of 19.2 ms. In each time interval,we use the linear regression of time and phase on one channel to remove small phase error after our correction algorithm.The tracking direction is determined by the sign of the slope of the regression line of both receivers.The tracking distance is determined by the phase change of the regression line of both receivers.Figure 15(a)shows the error of movement direction of four different scenarios.The four scenarios contain 8 different samples where the volunteer pushes his/her hand along these paths forth and back.Our absolute direction error is calculated in each time interval.Our pushing direction accuracy is similar to those in WiDir [33],which tracks the walking direction.However,the walking human tracked in WiDir has bigger reflection area than the hand tracked in QGesture.This indicates that utilizing our phase information after removing phase offset is more accurate than utilizing amplitude information.Figure 15(b)shows the distance error of pushing 40 cm of the corresponding direction.The distance of these different directions is calculated by the distance between the ending point and the starting point. Operational Distance:QGesture achieves distance measurement accuracy of smaller than 5.5 cm within dis- tance of 2 meters.Figure 16(a)shows the average amplitude of CSI variations caused by hand movement with different distances between the hand and receiver(Du in Figure 11(b)).We observe that the amplitude of CSI variations reduces when the distance between the user to the receiver increases.Our experiments show that the average amplitude of CSI variation during the silent period is 0.71 with a standard deviation of 0.46.Based on these measurements,we set the empirical threshold T used in LEVD algorithm to 2,which is three times of the standard deviation away from the mean,so that it can reliably detect gestures performed at 2 meters away. Proceedings of the ACM on Human-Computer Interaction,Vol.1,No.4,Article 39.Publication date:March 2018.QGesture: Quantifying Gesture Distance and Direction with WiFi Signals • 39:15 Tx Rx Push direction Table (a) NLOS scenario. Table Table 7.7 m 6.5 m Dt Rx Tx Du Push direction (b) LOS scenario. Fig. 11. Experiment setups. cm for Largest-PCI. This is because that the shorter the pushing distance, the smaller accumulated measurement distance error. In the following experiment, we call Largest-PCI as PCI and Hilbert-PCA as PCA for short. 1D Pushing Direction Accuracy: QGesture can reliably detect the pushing direction with accuracy more than 95% with the latency of 0.2 seconds. Figure 14 shows the movement direction accuracy of 5 different people pushing at a distance of 1 meter to the receiver. The detection accuracy increases when we use longer pushing samples for detection. For all users, the direction can be determined with more than 95% accuracy when using a pushing sample of 0.2 seconds. 2D Pushing Direction and Distance Accuracy: At a distance of 1 meter, the overall mean absolute direction error of tracking the straight line in different directions in a normal conference is 15.19 degrees and the overall mean measurement error in distance is 3.75 cm for pushing 40 cm. Figure 9(b) shows our two dimensional scene setting depicted as Section 4.4. Figure 13 shows the tracking result of a volunteer pushing 57 cm with an angle of 45 degrees. The initial location is measured beforehand. We track the hand location with a time interval of 19.2 ms. In each time interval, we use the linear regression of time and phase on one channel to remove small phase error after our correction algorithm. The tracking direction is determined by the sign of the slope of the regression line of both receivers. The tracking distance is determined by the phase change of the regression line of both receivers. Figure 15(a) shows the error of movement direction of four different scenarios. The four scenarios contain 8 different samples where the volunteer pushes his/her hand along these paths forth and back. Our absolute direction error is calculated in each time interval. Our pushing direction accuracy is similar to those in WiDir [33], which tracks the walking direction. However, the walking human tracked in WiDir has bigger reflection area than the hand tracked in QGesture. This indicates that utilizing our phase information after removing phase offset is more accurate than utilizing amplitude information. Figure 15(b) shows the distance error of pushing 40 cm of the corresponding direction. The distance of these different directions is calculated by the distance between the ending point and the starting point. Operational Distance: QGesture achieves distance measurement accuracy of smaller than 5.5 cm within distance of 2 meters. Figure 16(a) shows the average amplitude of CSI variations caused by hand movement with different distances between the hand and receiver (Du in Figure 11(b)). We observe that the amplitude of CSI variations reduces when the distance between the user to the receiver increases. Our experiments show that the average amplitude of CSI variation during the silent period is 0.71 with a standard deviation of 0.46. Based on these measurements, we set the empirical threshold T used in LEVD algorithm to 2, which is three times of the standard deviation away from the mean, so that it can reliably detect gestures performed at 2 meters away. Proceedings of the ACM on Human-Computer Interaction, Vol. 1, No. 4, Article 39. Publication date: March 2018