正在加载图片...
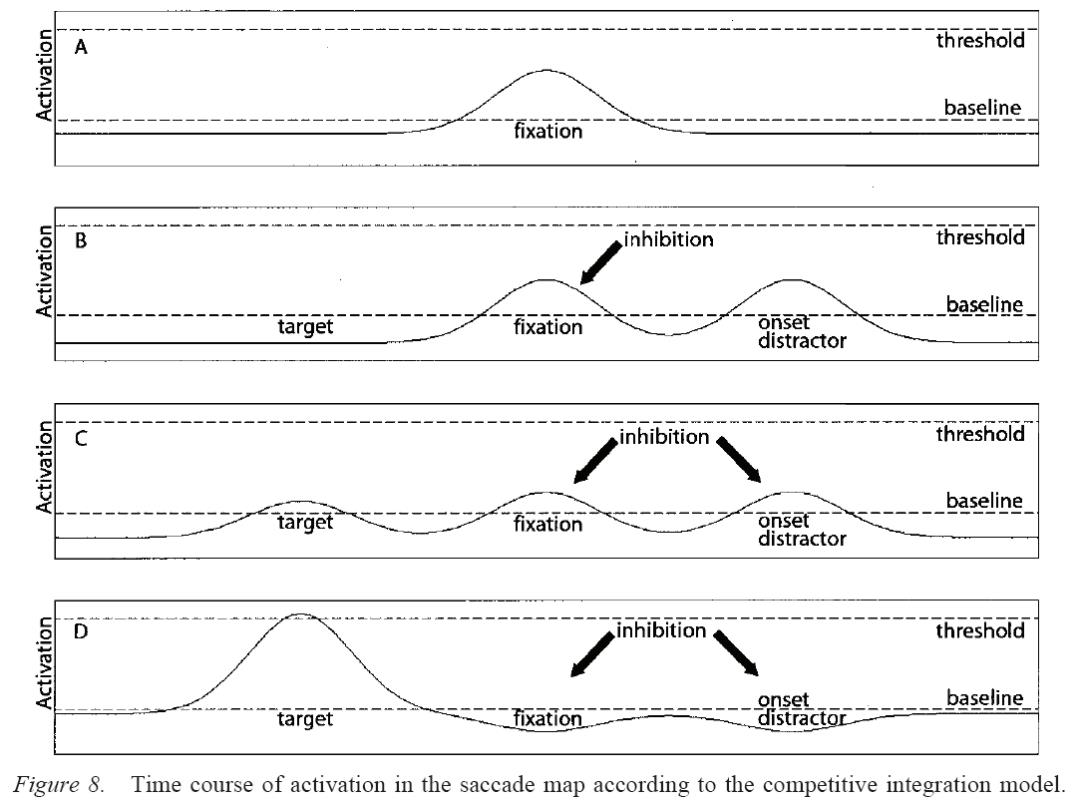
A threshold baseline fixation B inhibition threshold baseline_ target fixation onset distractor C inhibition threshold baseline target fixation onset distractor D inhibition threshold onset distractor-- baseline target fixation Figure 8.Time course of activation in the saccade map according to the competitive integration model