正在加载图片...
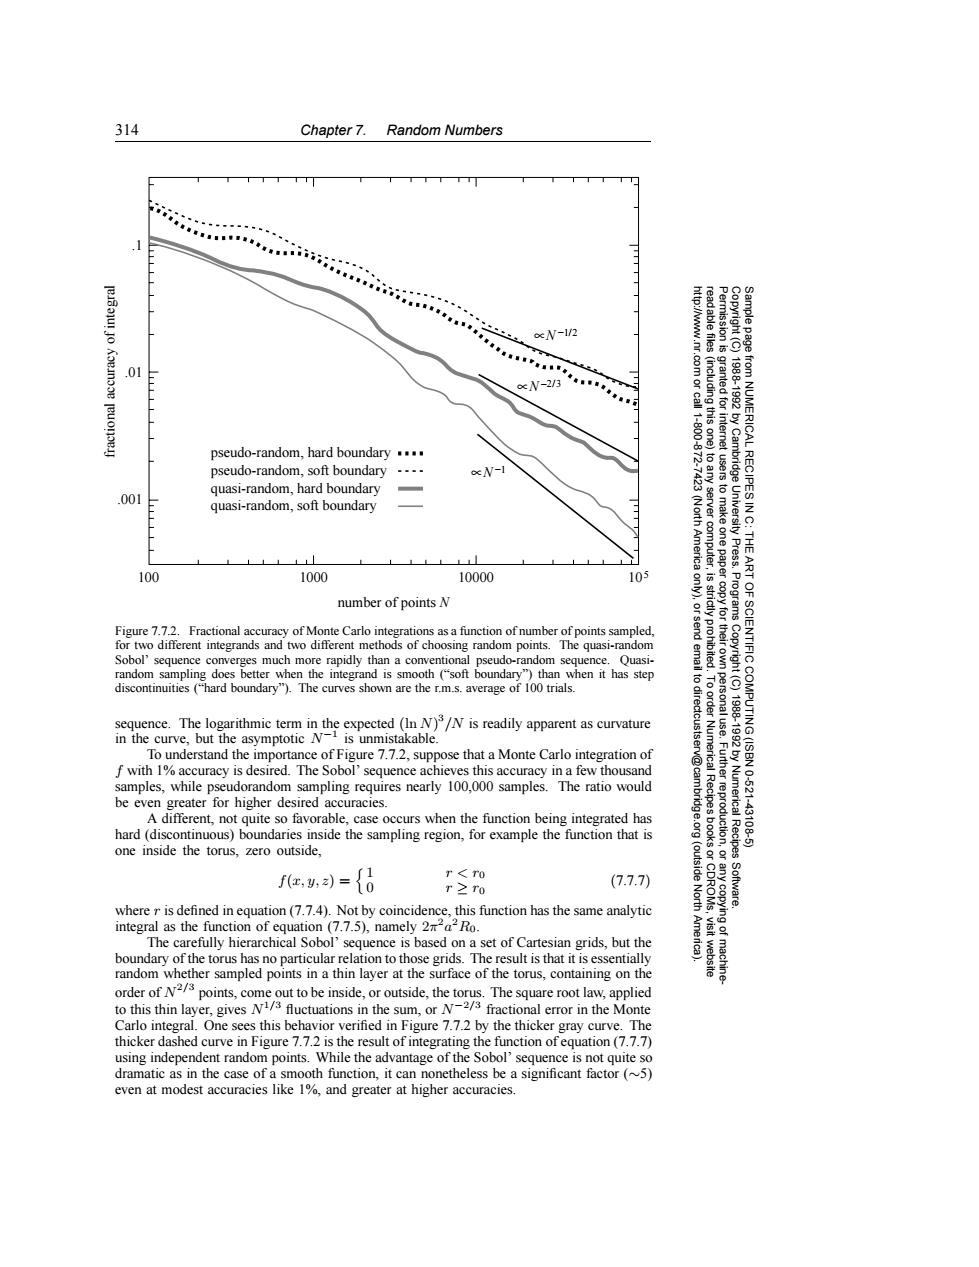
314 Chapter 7.Random Numbers * N-1/2 .01 oc N-2/3 83 pseudo-random,hard boundary... 11-800-872 (including this one) pseudo-random,soft boundary N-1 quasi-random,hard boundary 7423 .001 to any server computer, tusers to make one paper 1988-1992 by Cambridge University Press. from NUMERICAL RECIPES IN C: quasi-random,soft boundary (North America THE 100 1000 10000 105 是 number of points N Programs Figure 7.7.2.Fractional accuracy of Monte Carlo integrations as a function of number of points sampled for two different integrands and two different methods of choosing random points.The quasi-random Sobol'sequence converges much more rapidly than a conventional pseudo-random sequence.Quasi- random sampling does better when the integrand is smooth(soft boundary")than when it has step discontinuities ("hard boundary").The curves shown are the r.m.s.average of 100 trials. to dir sequence.The logarithmic term in the expected(In N)/N is readily apparent as curvature ART OF SCIENTIFIC COMPUTING (ISBN in the curve,but the asymptotic N-is unmistakable. ectcustser 1788-1982 To understand the importance of Figure 7.7.2,suppose that a Monte Carlo integration of f with 1%accuracy is desired.The Sobol'sequence achieves this accuracy in a few thousand v@cam samples,while pseudorandom sampling requires nearly 100,000 samples.The ratio would be even greater for higher desired accuracies. A different,not quite so favorable,case occurs when the function being integrated has hard (discontinuous)boundaries inside the sampling region,for example the function that is Numerical Recipes 10-621 43108 one inside the torus,zero outside, fe,={8 (outside r≥ro (7.7.7) Software. where r is defined in equation(7.7.4).Not by coincidence,this function has the same analytic North integral as the function of equation (7.7.5),namely 2aRo. The carefully hierarchical Sobol'sequence is based on a set of Cartesian grids,but the boundary of the torus has no particular relation to those grids.The result is that it is essentially random whether sampled points in a thin layer at the surface of the torus,containing on the order of N2/3 points,come out to be inside,or outside,the torus.The square root law,applied to this thin layer,gives N/3 fluctuations in the sum,or N-2/3 fractional error in the Monte Carlo integral.One sees this behavior verified in Figure 7.7.2 by the thicker gray curve.The thicker dashed curve in Figure 7.7.2 is the result of integrating the function ofequation(7.7.7) using independent random points.While the advantage of the Sobol'sequence is not quite so dramatic as in the case of a smooth function,it can nonetheless be a significant factor (~5) even at modest accuracies like 1%,and greater at higher accuracies.314 Chapter 7. Random Numbers Permission is granted for internet users to make one paper copy for their own personal use. Further reproduction, or any copyin Copyright (C) 1988-1992 by Cambridge University Press. Programs Copyright (C) 1988-1992 by Numerical Recipes Software. Sample page from NUMERICAL RECIPES IN C: THE ART OF SCIENTIFIC COMPUTING (ISBN 0-521-43108-5) g of machinereadable files (including this one) to any server computer, is strictly prohibited. To order Numerical Recipes books or CDROMs, visit website http://www.nr.com or call 1-800-872-7423 (North America only), or send email to directcustserv@cambridge.org (outside North America). .001 .01 .1 fractional accuracy of integral number of points N 100 1000 10000 105 ∝N−1/2 ∝N−2/3 ∝N−1 quasi-random, hard boundary pseudo-random, soft boundary pseudo-random, hard boundary quasi-random, soft boundary Figure 7.7.2. Fractional accuracy of Monte Carlo integrations as a function of number of points sampled, for two different integrands and two different methods of choosing random points. The quasi-random Sobol’ sequence converges much more rapidly than a conventional pseudo-random sequence. Quasirandom sampling does better when the integrand is smooth (“soft boundary”) than when it has step discontinuities (“hard boundary”). The curves shown are the r.m.s. average of 100 trials. sequence. The logarithmic term in the expected (ln N) 3/N is readily apparent as curvature in the curve, but the asymptotic N−1 is unmistakable. To understand the importance of Figure 7.7.2, suppose that a Monte Carlo integration of f with 1% accuracy is desired. The Sobol’ sequence achieves this accuracy in a few thousand samples, while pseudorandom sampling requires nearly 100,000 samples. The ratio would be even greater for higher desired accuracies. A different, not quite so favorable, case occurs when the function being integrated has hard (discontinuous) boundaries inside the sampling region, for example the function that is one inside the torus, zero outside, f(x, y, z) = 1 r<r0 0 r ≥ r0 (7.7.7) where r is defined in equation (7.7.4). Not by coincidence, this function has the same analytic integral as the function of equation (7.7.5), namely 2π2a2R0. The carefully hierarchical Sobol’ sequence is based on a set of Cartesian grids, but the boundary of the torus has no particular relation to those grids. The result is that it is essentially random whether sampled points in a thin layer at the surface of the torus, containing on the order of N2/3 points, come out to be inside, or outside, the torus. The square root law, applied to this thin layer, gives N1/3 fluctuations in the sum, or N−2/3 fractional error in the Monte Carlo integral. One sees this behavior verified in Figure 7.7.2 by the thicker gray curve. The thicker dashed curve in Figure 7.7.2 is the result of integrating the function of equation (7.7.7) using independent random points. While the advantage of the Sobol’ sequence is not quite so dramatic as in the case of a smooth function, it can nonetheless be a significant factor (∼5) even at modest accuracies like 1%, and greater at higher accuracies