正在加载图片...
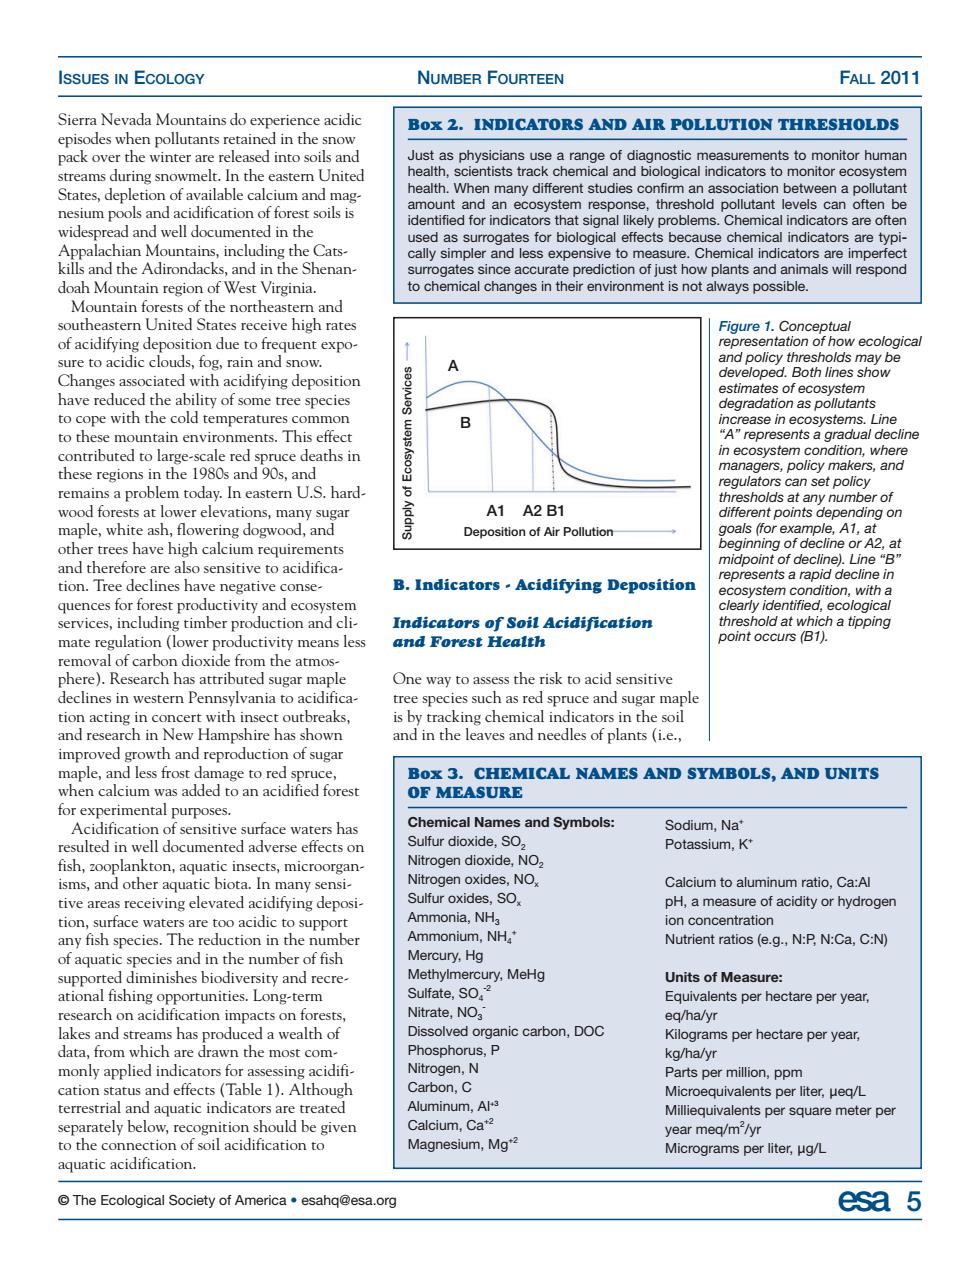
ISSUES IN ECOLOGY NUMBER FOURTEEN FALL 2011 Sierra nevada mountains do e e acidic episodeswhen pollutants retained in the snow Box 2.INDICATORS AND AIR POLLUTION THRESHOLDS pack ove r the winter are re nesium pools and acidification of forest soils is widespread and well documented n the al indic e oof just hov doah Mountain region of West Virginia. to chemical changes in their environment is not always possible. Montatnfs5fthenorttS and A oth lines to these mountain environments.This effect tafegTrd80cedcathsim remains problem today n.S.hard can set A1 A2 B1 nt d ing on gwo Deposition of Air Pollution and therefore are also sensitive to acidifica B.Indicators.Acidifying Deposition dition with quence and cli Indicators of Soil Acidification and forest Heatth eclines in w pl ncert with insect outbreaks, and in the leaves and needles of plants (i.e., of suga Box 3.CHEMICAL NAMES AND SYMBOLS,AND UNITS OF MEASURE Chemical Names and Symbols: Sodium,Na' dioxide.NO Potassium.K ie evated Nitrogen oxides.NO tio.Ca:Al Sulfur oxides,SO. on concentration any fish species.The reduction in then Nutrient ratios(e.g..N:P.N:Ca.C:N) of aquatic he number ry.MeHg Units of Measu omfe的eo Sulfate,SO Equivalents per hectare per year, trate,NO eq/ha/yr data srams a monly applied indicators for a Nitrogen,N Parts per million,ppm terrest aquatic ind Calcium,Ca Milliequivalents per square meter per Magnesium.Ma liter,ug/L aquatic acidification. The Ecological Society of America esahq@esa.org esa 5© The Ecological Society of America • esahq@esa.org esa 5 ISSUES IN ECOLOGY NUMBER FOURTEEN FALL 2011 Sierra Nevada Mountains do experience acidic episodes when pollutants retained in the snow pack over the winter are released into soils and streams during snowmelt. In the eastern United States, depletion of available calcium and magnesium pools and acidification of forest soils is widespread and well documented in the Appalachian Mountains, including the Catskills and the Adirondacks, and in the Shenandoah Mountain region of West Virginia. Mountain forests of the northeastern and southeastern United States receive high rates of acidifying deposition due to frequent exposure to acidic clouds, fog, rain and snow. Changes associated with acidifying deposition have reduced the ability of some tree species to cope with the cold temperatures common to these mountain environments. This effect contributed to large-scale red spruce deaths in these regions in the 1980s and 90s, and remains a problem today. In eastern U.S. hardwood forests at lower elevations, many sugar maple, white ash, flowering dogwood, and other trees have high calcium requirements and therefore are also sensitive to acidification. Tree declines have negative consequences for forest productivity and ecosystem services, including timber production and climate regulation (lower productivity means less removal of carbon dioxide from the atmosphere). Research has attributed sugar maple declines in western Pennsylvania to acidification acting in concert with insect outbreaks, and research in New Hampshire has shown improved growth and reproduction of sugar maple, and less frost damage to red spruce, when calcium was added to an acidified forest for experimental purposes. Acidification of sensitive surface waters has resulted in well documented adverse effects on fish, zooplankton, aquatic insects, microorganisms, and other aquatic biota. In many sensitive areas receiving elevated acidifying deposition, surface waters are too acidic to support any fish species. The reduction in the number of aquatic species and in the number of fish supported diminishes biodiversity and recreational fishing opportunities. Long-term research on acidification impacts on forests, lakes and streams has produced a wealth of data, from which are drawn the most commonly applied indicators for assessing acidification status and effects (Table 1). Although terrestrial and aquatic indicators are treated separately below, recognition should be given to the connection of soil acidification to aquatic acidification. B. Indicators - Acidifying Deposition Indicators of Soil Acidification and Forest Health One way to assess the risk to acid sensitive tree species such as red spruce and sugar maple is by tracking chemical indicators in the soil and in the leaves and needles of plants (i.e., Box 2. INDICATORS AND AIR POLLUTION THRESHOLDS Just as physicians use a range of diagnostic measurements to monitor human health, scientists track chemical and biological indicators to monitor ecosystem health. When many different studies confirm an association between a pollutant amount and an ecosystem response, threshold pollutant levels can often be identified for indicators that signal likely problems. Chemical indicators are often used as surrogates for biological effects because chemical indicators are typically simpler and less expensive to measure. Chemical indicators are imperfect surrogates since accurate prediction of just how plants and animals will respond to chemical changes in their environment is not always possible. Box 3. CHEMICAL NAMES AND SYMBOLS, AND UNITS OF MEASURE Chemical Names and Symbols: Sulfur dioxide, SO2 Nitrogen dioxide, NO2 Nitrogen oxides, NOx Sulfur oxides, SOx Ammonia, NH3 Ammonium, NH4 + Mercury, Hg Methylmercury, MeHg Sulfate, SO4 -2 Nitrate, NO3 - Dissolved organic carbon, DOC Phosphorus, P Nitrogen, N Carbon, C Aluminum, Al+3 Calcium, Ca+2 Magnesium, Mg+2 Sodium, Na+ Potassium, K+ Calcium to aluminum ratio, Ca:Al pH, a measure of acidity or hydrogen ion concentration Nutrient ratios (e.g., N:P, N:Ca, C:N) Units of Measure: Equivalents per hectare per year, eq/ha/yr Kilograms per hectare per year, kg/ha/yr Parts per million, ppm Microequivalents per liter, µeq/L Milliequivalents per square meter per year meq/m2 /yr Micrograms per liter, µg/L Figure 1. Conceptual representation of how ecological and policy thresholds may be developed. Both lines show estimates of ecosystem degradation as pollutants increase in ecosystems. Line “A” represents a gradual decline in ecosystem condition, where managers, policy makers, and regulators can set policy thresholds at any number of different points depending on goals (for example, A1, at beginning of decline or A2, at midpoint of decline). Line “B” represents a rapid decline in ecosystem condition, with a clearly identified, ecological threshold at which a tipping point occurs (B1). A B A1 A2 B1 Supply of Ecosystem Services Deposition of Air Pollution