正在加载图片...
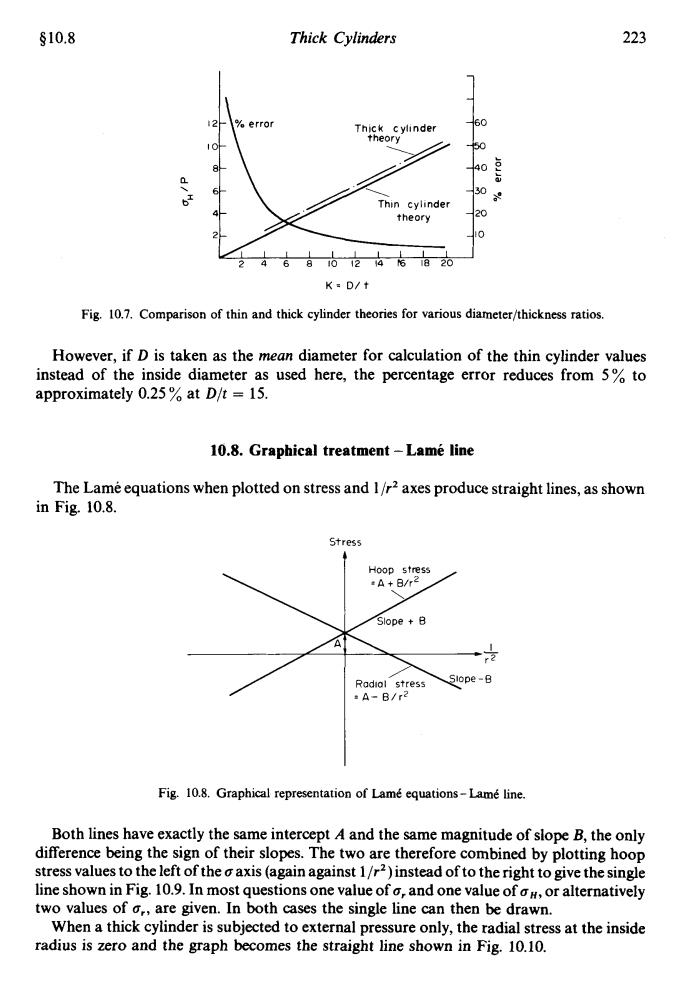
§10.8 Thick Cylinders 223 error Thick cylinder 60 theory 50 40 6 30 Thin cylinder ole theory 20 0 24古日4后 K=D/t Fig.10.7.Comparison of thin and thick cylinder theories for various diameter/thickness ratios. However,if D is taken as the mean diameter for calculation of the thin cylinder values instead of the inside diameter as used here,the percentage error reduces from 5%to approximately 0.25%at D/t =15. 10.8.Graphical treatment-Lame line The Lame equations when plotted on stress and I/r2 axes produce straight lines,as shown in Fig.10.8. Stress Hoop stress .A+8/r2 Slope B Radiol stress Slope-B .A-B/r2 Fig.10.8.Graphical representation of Lame equations-Lame line. Both lines have exactly the same intercept A and the same magnitude of slope B,the only difference being the sign of their slopes.The two are therefore combined by plotting hoop stress values to the left of the axis(again against 1/r2)instead of to the right to give the single line shown in Fig.10.9.In most questions one value of o,and one value of o#,or alternatively two values of o,,are given.In both cases the single line can then be drawn. When a thick cylinder is subjected to external pressure only,the radial stress at the inside radius is zero and the graph becomes the straight line shown in Fig.10.10.$10.8 Thick Cylinders 223 1 Thick cylinder theory a 60 40 K= D/1 Fig. 10.7. Comparison of thin and thick cylinder theories for various diarneter/thickness ratios. However, if D is taken as the mean diameter for calculation of the thin cylinder values instead of the inside diameter as used here, the percentage error reduces from 5% to approximately 0.25 % at D/t = 15. 10.8. Graphical treatment -Lame line The Lame equations when plotted on stress and 1 /rz axes produce straight lines, as shown in Fig. 10.8. Stress b Rodiol' stress yo' / =A- B/r' Fig. 10.8. Graphical representation of Lam6 equations- Lam6 line. Both lines have exactly the same intercept A and the same magnitude of slope B, the only difference being the sign of their slopes. The two are therefore combined by plotting hoop stress values to the left of the aaxis (again against l/rz) instead of to the right to give the single line shown in Fig. 10.9. In most questions one value of a, and one value of oH, or alternatively two values of c,, are given. In both cases the single line can then be drawn. When a thick cylinder is subjected to external pressure only, the radial stress at the inside radius is zero and the graph becomes the straight line shown in Fig. 10.10