正在加载图片...
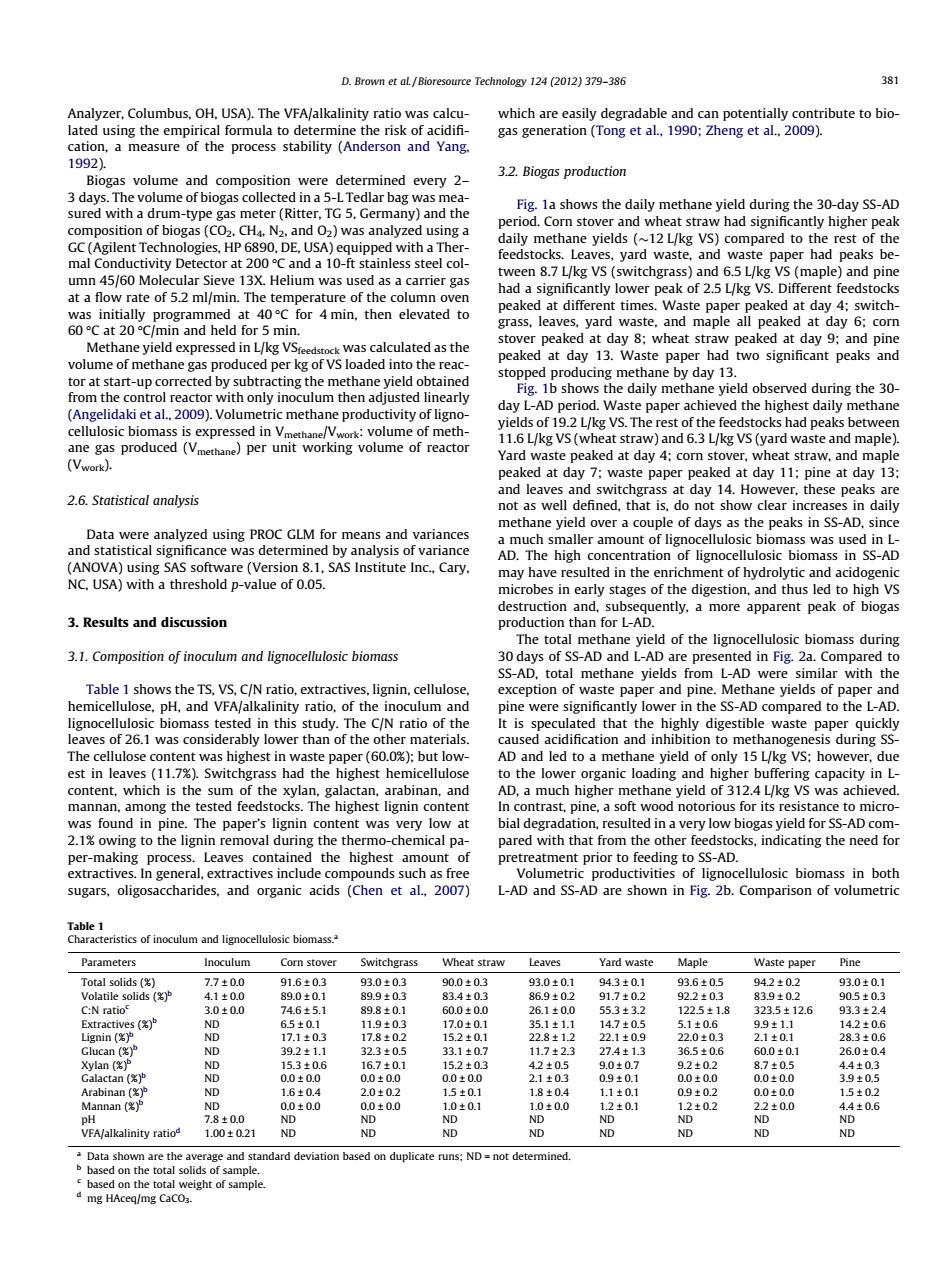
D.Brown et al/Bioresource Technology 124(2012)379-386 381 Analyzer,Columbus,OH,USA).The VFA/alkalinity ratio was calcu- which are easily degradable and can potentially contribute to bio- lated using the empirical formula to determine the risk of acidifi- gas generation(Tong et al.,1990;Zheng et al.,2009). cation,a measure of the process stability (Anderson and Yang. 1992) Biogas volume and composition were determined every 2- 3.2.Biogas production 3 days.The volume of biogas collected in a 5-L Tedlar bag was mea- Fig.1a shows the daily methane yield during the 30-day SS-AD sured with a drum-type gas meter(Ritter,TG 5,Germany)and the composition of biogas(CO2.CH4.N2.and O2)was analyzed using a period.Corn stover and wheat straw had significantly higher peak daily methane yields (~12 L/kg VS)compared to the rest of the GC(Agilent Technologies,HP 6890,DE,USA)equipped with a Ther- feedstocks.Leaves,yard waste,and waste paper had peaks be- mal Conductivity Detector at 200C and a 10-ft stainless steel col- tween 8.7 L/kg VS(switchgrass)and 6.5 L/kg VS(maple)and pine umn 45/60 Molecular Sieve 13X.Helium was used as a carrier gas had a significantly lower peak of 2.5 L/kg VS.Different feedstocks at a flow rate of 5.2 ml/min.The temperature of the column oven peaked at different times.Waste paper peaked at day 4;switch- was initially programmed at 40C for 4 min,then elevated to 60 C at 20C/min and held for 5 min. grass,leaves,yard waste,and maple all peaked at day 6;corn stover peaked at day 8:wheat straw peaked at day 9;and pine Methane yield expressed in L/kg VSfeedstock was calculated as the peaked at day 13.Waste paper had two significant peaks and volume of methane gas produced per kg of VS loaded into the reac- tor at start-up corrected by subtracting the methane yield obtained stopped producing methane by day 13. Fig.1b shows the daily methane yield observed during the 30- from the control reactor with only inoculum then adjusted linearly (Angelidaki et al.,2009).Volumetric methane productivity of ligno- day L-AD period.Waste paper achieved the highest daily methane yields of 19.2 L/kg VS.The rest of the feedstocks had peaks between cellulosic biomass is expressed in Vmethane/Vwork:volume of meth- 11.6 L/kg VS(wheat straw)and 6.3 L/kg VS(yard waste and maple). ane gas produced (Vmethane)per unit working volume of reactor Yard waste peaked at day 4;corn stover,wheat straw,and maple (Vwork). peaked at day 7:waste paper peaked at day 11:pine at day 13: and leaves and switchgrass at day 14.However,these peaks are 2.6.Statistical analysis not as well defined,that is,do not show clear increases in daily methane yield over a couple of days as the peaks in SS-AD,since Data were analyzed using PROC GLM for means and variances a much smaller amount of lignocellulosic biomass was used in L- and statistical significance was determined by analysis of variance AD.The high concentration of lignocellulosic biomass in SS-AD (ANOVA)using SAS software (Version 8.1,SAS Institute Inc.,Cary. may have resulted in the enrichment of hydrolytic and acidogenic NC,USA)with a threshold p-value of 0.05 microbes in early stages of the digestion,and thus led to high VS destruction and,subsequently,a more apparent peak of biogas 3.Results and discussion production than for L-AD. The total methane yield of the lignocellulosic biomass during 3.1.Composition of inoculum and lignocellulosic biomass 30 days of SS-AD and L-AD are presented in Fig.2a.Compared to SS-AD,total methane yields from L-AD were similar with the Table 1 shows the TS,VS,C/N ratio,extractives,lignin,cellulose, exception of waste paper and pine.Methane yields of paper and hemicellulose,pH,and VFA/alkalinity ratio,of the inoculum and pine were significantly lower in the SS-AD compared to the L-AD. lignocellulosic biomass tested in this study.The C/N ratio of the It is speculated that the highly digestible waste paper quickly leaves of 26.1 was considerably lower than of the other materials. caused acidification and inhibition to methanogenesis during SS- The cellulose content was highest in waste paper(60.0%):but low- AD and led to a methane yield of only 15 L/kg VS;however,due est in leaves (11.7%).Switchgrass had the highest hemicellulose to the lower organic loading and higher buffering capacity in L- content,which is the sum of the xylan,galactan,arabinan,and AD,a much higher methane yield of 312.4 L/kg VS was achieved mannan,among the tested feedstocks.The highest lignin content In contrast,pine,a soft wood notorious for its resistance to micro- was found in pine.The paper's lignin content was very low at bial degradation,resulted in a very low biogas yield for SS-AD com- 2.1%owing to the lignin removal during the thermo-chemical pa- pared with that from the other feedstocks,indicating the need for per-making process.Leaves contained the highest amount of pretreatment prior to feeding to SS-AD. extractives.In general,extractives include compounds such as free Volumetric productivities of lignocellulosic biomass in both sugars,oligosaccharides,and organic acids (Chen et al.,2007) L-AD and SS-AD are shown in Fig.2b.Comparison of volumetric Table 1 Characteristics of inoculum and lignocellulosic biomass. Parameters Inoculum Corn stover Switchgrass Wheat straw Leaves Yard waste Maple Waste paper Pine Total solids ( 7.7±0.0 91.6±03 93.0±03 90.0±0.3 93.0±0.1 943±0.1 93.6±0.5 94.2±02 93.0±0.1 Volatile solids 4.1±0.0 89.0±0.1 89.9±0.3 83.4±0.3 86.9±02 91.7±0.2 92.2±0.3 83.9±0.2 90.5±0.3 C:N ratio 3.0±0.0 746±5.1 898±0.1 60.0±00 26.1±00 553±32 1225±18 323.5±12.6 933±2.4 Extractives ( ND 65±0.1 11.9±0.3 17.0±0.1 35.1±1.1 14.7±0.5 5.1±0.6 9.9±1.1 14.2±0.6 Lignin(%泸 ND 17.1±0.3 17.8±0.2 15.2±0.1 22.8±1.2 22.1±0.9 22.0±0.3 2.1±0.1 28.3±0.6 Glucan ( ND 39.2±1.1 32.3±0.5 33.1±0.7 11.7±2.3 27.4±1.3 36.5±0.6 60.0±0.1 26.0±0.4 Xylan ( ND 15.3±0.6 16.7±0.1 15.2±0.3 42±0.5 9.0±0.7 9.2±0.2 8.7±0.5 4.4±0.3 Galactan ( ND 0.0±0.0 0.0±0.0 0.0±0.0 2.1±03 0.9±0.1 0.0±0.0 0.0±0.0 39±0.5 Arabinan ( ND 1.6±0.4 2.0±0.2 15±0.1 18±0.4 1.1±0.1 09±0.2 0.0±0.0 15±0.2 Mannan ( ND 0.0±0.0 0.0±0.0 10±0.1 1.0±0.0 1.2±0.1 12±02 22±0.0 4.4±0.6 pH 7.8±0.0 ND ND ND ND ND ND ND ND VFA/alkalinity ratio 1.00±021 ND ND ND ND ND ND ND ND a Data shown are the average and standard deviation based on duplicate runs:ND=not determined. b based on the total solids of sample. based on the total weight of sample. mg HAceq/mg CaCO3.Analyzer, Columbus, OH, USA). The VFA/alkalinity ratio was calculated using the empirical formula to determine the risk of acidifi- cation, a measure of the process stability (Anderson and Yang, 1992). Biogas volume and composition were determined every 2– 3 days. The volume of biogas collected in a 5-L Tedlar bag was measured with a drum-type gas meter (Ritter, TG 5, Germany) and the composition of biogas (CO2, CH4, N2, and O2) was analyzed using a GC (Agilent Technologies, HP 6890, DE, USA) equipped with a Thermal Conductivity Detector at 200 C and a 10-ft stainless steel column 45/60 Molecular Sieve 13X. Helium was used as a carrier gas at a flow rate of 5.2 ml/min. The temperature of the column oven was initially programmed at 40 C for 4 min, then elevated to 60 C at 20 C/min and held for 5 min. Methane yield expressed in L/kg VSfeedstock was calculated as the volume of methane gas produced per kg of VS loaded into the reactor at start-up corrected by subtracting the methane yield obtained from the control reactor with only inoculum then adjusted linearly (Angelidaki et al., 2009). Volumetric methane productivity of lignocellulosic biomass is expressed in Vmethane/Vwork: volume of methane gas produced (Vmethane) per unit working volume of reactor (Vwork). 2.6. Statistical analysis Data were analyzed using PROC GLM for means and variances and statistical significance was determined by analysis of variance (ANOVA) using SAS software (Version 8.1, SAS Institute Inc., Cary, NC, USA) with a threshold p-value of 0.05. 3. Results and discussion 3.1. Composition of inoculum and lignocellulosic biomass Table 1 shows the TS, VS, C/N ratio, extractives, lignin, cellulose, hemicellulose, pH, and VFA/alkalinity ratio, of the inoculum and lignocellulosic biomass tested in this study. The C/N ratio of the leaves of 26.1 was considerably lower than of the other materials. The cellulose content was highest in waste paper (60.0%); but lowest in leaves (11.7%). Switchgrass had the highest hemicellulose content, which is the sum of the xylan, galactan, arabinan, and mannan, among the tested feedstocks. The highest lignin content was found in pine. The paper’s lignin content was very low at 2.1% owing to the lignin removal during the thermo-chemical paper-making process. Leaves contained the highest amount of extractives. In general, extractives include compounds such as free sugars, oligosaccharides, and organic acids (Chen et al., 2007) which are easily degradable and can potentially contribute to biogas generation (Tong et al., 1990; Zheng et al., 2009). 3.2. Biogas production Fig. 1a shows the daily methane yield during the 30-day SS-AD period. Corn stover and wheat straw had significantly higher peak daily methane yields (12 L/kg VS) compared to the rest of the feedstocks. Leaves, yard waste, and waste paper had peaks between 8.7 L/kg VS (switchgrass) and 6.5 L/kg VS (maple) and pine had a significantly lower peak of 2.5 L/kg VS. Different feedstocks peaked at different times. Waste paper peaked at day 4; switchgrass, leaves, yard waste, and maple all peaked at day 6; corn stover peaked at day 8; wheat straw peaked at day 9; and pine peaked at day 13. Waste paper had two significant peaks and stopped producing methane by day 13. Fig. 1b shows the daily methane yield observed during the 30- day L-AD period. Waste paper achieved the highest daily methane yields of 19.2 L/kg VS. The rest of the feedstocks had peaks between 11.6 L/kg VS (wheat straw) and 6.3 L/kg VS (yard waste and maple). Yard waste peaked at day 4; corn stover, wheat straw, and maple peaked at day 7; waste paper peaked at day 11; pine at day 13; and leaves and switchgrass at day 14. However, these peaks are not as well defined, that is, do not show clear increases in daily methane yield over a couple of days as the peaks in SS-AD, since a much smaller amount of lignocellulosic biomass was used in LAD. The high concentration of lignocellulosic biomass in SS-AD may have resulted in the enrichment of hydrolytic and acidogenic microbes in early stages of the digestion, and thus led to high VS destruction and, subsequently, a more apparent peak of biogas production than for L-AD. The total methane yield of the lignocellulosic biomass during 30 days of SS-AD and L-AD are presented in Fig. 2a. Compared to SS-AD, total methane yields from L-AD were similar with the exception of waste paper and pine. Methane yields of paper and pine were significantly lower in the SS-AD compared to the L-AD. It is speculated that the highly digestible waste paper quickly caused acidification and inhibition to methanogenesis during SSAD and led to a methane yield of only 15 L/kg VS; however, due to the lower organic loading and higher buffering capacity in LAD, a much higher methane yield of 312.4 L/kg VS was achieved. In contrast, pine, a soft wood notorious for its resistance to microbial degradation, resulted in a very low biogas yield for SS-AD compared with that from the other feedstocks, indicating the need for pretreatment prior to feeding to SS-AD. Volumetric productivities of lignocellulosic biomass in both L-AD and SS-AD are shown in Fig. 2b. Comparison of volumetric Table 1 Characteristics of inoculum and lignocellulosic biomass.a Parameters Inoculum Corn stover Switchgrass Wheat straw Leaves Yard waste Maple Waste paper Pine Total solids (%) 7.7 ± 0.0 91.6 ± 0.3 93.0 ± 0.3 90.0 ± 0.3 93.0 ± 0.1 94.3 ± 0.1 93.6 ± 0.5 94.2 ± 0.2 93.0 ± 0.1 Volatile solids (%)b 4.1 ± 0.0 89.0 ± 0.1 89.9 ± 0.3 83.4 ± 0.3 86.9 ± 0.2 91.7 ± 0.2 92.2 ± 0.3 83.9 ± 0.2 90.5 ± 0.3 C:N ratioc 3.0 ± 0.0 74.6 ± 5.1 89.8 ± 0.1 60.0 ± 0.0 26.1 ± 0.0 55.3 ± 3.2 122.5 ± 1.8 323.5 ± 12.6 93.3 ± 2.4 Extractives (%)b ND 6.5 ± 0.1 11.9 ± 0.3 17.0 ± 0.1 35.1 ± 1.1 14.7 ± 0.5 5.1 ± 0.6 9.9 ± 1.1 14.2 ± 0.6 Lignin (%)b ND 17.1 ± 0.3 17.8 ± 0.2 15.2 ± 0.1 22.8 ± 1.2 22.1 ± 0.9 22.0 ± 0.3 2.1 ± 0.1 28.3 ± 0.6 Glucan (%)b ND 39.2 ± 1.1 32.3 ± 0.5 33.1 ± 0.7 11.7 ± 2.3 27.4 ± 1.3 36.5 ± 0.6 60.0 ± 0.1 26.0 ± 0.4 Xylan (%)b ND 15.3 ± 0.6 16.7 ± 0.1 15.2 ± 0.3 4.2 ± 0.5 9.0 ± 0.7 9.2 ± 0.2 8.7 ± 0.5 4.4 ± 0.3 Galactan (%)b ND 0.0 ± 0.0 0.0 ± 0.0 0.0 ± 0.0 2.1 ± 0.3 0.9 ± 0.1 0.0 ± 0.0 0.0 ± 0.0 3.9 ± 0.5 Arabinan (%)b ND 1.6 ± 0.4 2.0 ± 0.2 1.5 ± 0.1 1.8 ± 0.4 1.1 ± 0.1 0.9 ± 0.2 0.0 ± 0.0 1.5 ± 0.2 Mannan (%)b ND 0.0 ± 0.0 0.0 ± 0.0 1.0 ± 0.1 1.0 ± 0.0 1.2 ± 0.1 1.2 ± 0.2 2.2 ± 0.0 4.4 ± 0.6 pH 7.8 ± 0.0 ND ND ND ND ND ND ND ND VFA/alkalinity ratiod 1.00 ± 0.21 ND ND ND ND ND ND ND ND a Data shown are the average and standard deviation based on duplicate runs; ND = not determined. b based on the total solids of sample. c based on the total weight of sample. d mg HAceq/mg CaCO3. D. Brown et al. / Bioresource Technology 124 (2012) 379–386 381�����