正在加载图片...

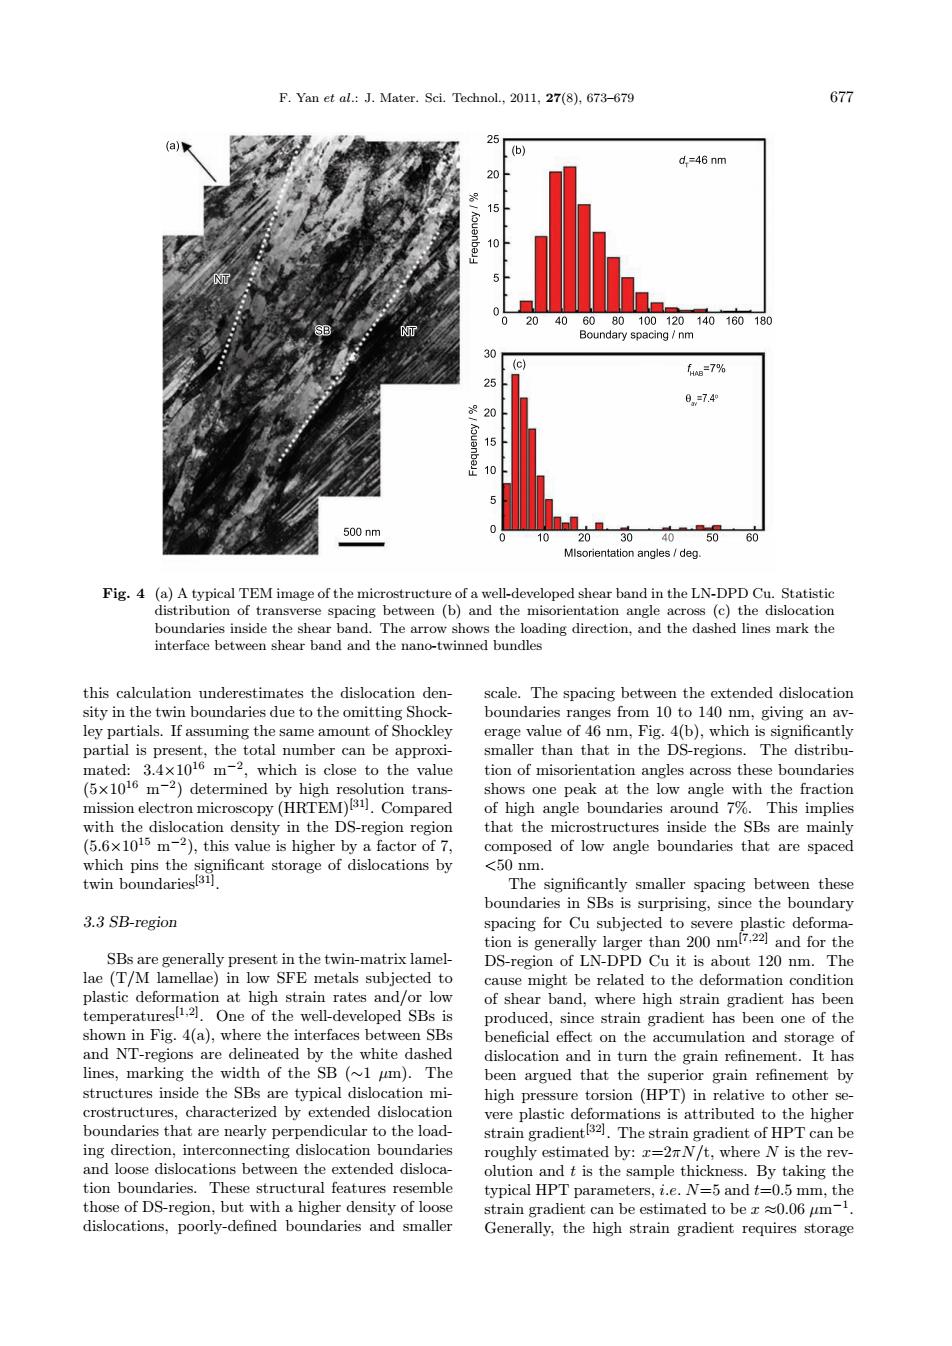
F.Yan et al.:J.Mater.Sci.Technol.,2011,27(8),673-679 677 (b) d,=46 nm anb 20406080100120140160180 Boundary spacing/nm 30 (c AB=7% 25 0=7.4° 20 15 10 500nm 0 10 20 30 50 60 MIsorientation angles /deg. Fig.4 (a)A typical TEM image of the microstructure of a well-developed shear band in the LN-DPD Cu.Statistic distribution of transverse spacing between (b)and the misorientation angle across (c)the dislocation boundaries inside the shear band.The arrow shows the loading direction,and the dashed lines mark the interface between shear band and the nano-twinned bundles this calculation underestimates the dislocation den- scale.The spacing between the extended dislocation sity in the twin boundaries due to the omitting Shock- boundaries ranges from 10 to 140 nm,giving an av- ley partials.If assuming the same amount of Shockley erage value of 46 nm,Fig.4(b),which is significantly partial is present,the total number can be approxi- smaller than that in the DS-regions.The distribu- mated:3.4x10¹⁶ m-2,which is close to the value tion of misorientation angles across these boundaries (5x10¹⁶ m-2)determined by high resolution trans- shows one peak at the low angle with the fraction mission electron microscopy(HRTEM)31).Compared of high angle boundaries around 7%.This implies with the dislocation density in the DS-region region that the microstructures inside the SBs are mainly (5.6x10¹⁵ m-2),this value is higher by a factor of 7, composed of low angle boundaries that are spaced which pins the significant storage of dislocations by <50nm. twin boundaries31l. The significantly smaller spacing between these boundaries in SBs is surprising,since the boundary 3.3 SB-region spacing for Cu subjected to severe plastic deforma- tion is generally larger than 200 nm7.22]and for the SBs are generally present in the twin-matrix lamel- DS-region of LN-DPD Cu it is about 120 nm.The lae (T/M lamellae)in low SFE metals subjected to cause might be related to the deformation condition plastic deformation at high strain rates and/or low of shear band.where high strain gradient has been temperatures[1.21.One of the well-developed SBs is produced,since strain gradient has been one of the shown in Fig.4(a),where the interfaces between SBs beneficial effect on the accumulation and storage of and NT-regions are delineated by the white dashed dislocation and in turn the grain refinement.It has lines,marking the width of the SB (~1 um).The been argued that the superior grain refinement by structures inside the SBs are typical dislocation mi- high pressure torsion (HPT)in relative to other se- crostructures,characterized by extended dislocation vere plastic deformations is attributed to the higher boundaries that are nearly perpendicular to the load- strain gradient 32).The strain gradient of HPT can be ing direction,interconnecting dislocation boundaries roughly estimated by:r=2mN/t,where N is the rev- and loose dislocations between the extended disloca olution and t is the sample thickness.By taking the tion boundaries.These structural features resemble typical HPT parameters,i.e.N=5 and t=0.5 mm,the those of DS-region,but with a higher density of loose strain gradient can be estimated to be r0.06 um-1. dislocations,poorly-defined boundaries and smaller Generally,the high strain gradient requires storageF. Yan et al.: J. Mater. Sci. Technol., 2011, 27(8), 673–679 677 Fig. 4 (a) A typical TEM image of the microstructure of a well-developed shear band in the LN-DPD Cu. Statistic distribution of transverse spacing between (b) and the misorientation angle across (c) the dislocation boundaries inside the shear band. The arrow shows the loading direction, and the dashed lines mark the interface between shear band and the nano-twinned bundles this calculation underestimates the dislocation density in the twin boundaries due to the omitting Shockley partials. If assuming the same amount of Shockley partial is present, the total number can be approximated: 3.4×10¹⁶ m−2, which is close to the value (5×10¹⁶ m−2) determined by high resolution transmission electron microscopy (HRTEM)[31]. Compared with the dislocation density in the DS-region region (5.6×10¹⁵ m−2), this value is higher by a factor of 7, which pins the significant storage of dislocations by twin boundaries[31]. 3.3 SB-region SBs are generally present in the twin-matrix lamellae (T/M lamellae) in low SFE metals subjected to plastic deformation at high strain rates and/or low temperatures[1,2]. One of the well-developed SBs is shown in Fig. 4(a), where the interfaces between SBs and NT-regions are delineated by the white dashed lines, marking the width of the SB (∼1 μm). The structures inside the SBs are typical dislocation microstructures, characterized by extended dislocation boundaries that are nearly perpendicular to the loading direction, interconnecting dislocation boundaries and loose dislocations between the extended dislocation boundaries. These structural features resemble those of DS-region, but with a higher density of loose dislocations, poorly-defined boundaries and smaller scale. The spacing between the extended dislocation boundaries ranges from 10 to 140 nm, giving an average value of 46 nm, Fig. 4(b), which is significantly smaller than that in the DS-regions. The distribution of misorientation angles across these boundaries shows one peak at the low angle with the fraction of high angle boundaries around 7%. This implies that the microstructures inside the SBs are mainly composed of low angle boundaries that are spaced <50 nm. The significantly smaller spacing between these boundaries in SBs is surprising, since the boundary spacing for Cu subjected to severe plastic deformation is generally larger than 200 nm[7,22] and for the DS-region of LN-DPD Cu it is about 120 nm. The cause might be related to the deformation condition of shear band, where high strain gradient has been produced, since strain gradient has been one of the beneficial effect on the accumulation and storage of dislocation and in turn the grain refinement. It has been argued that the superior grain refinement by high pressure torsion (HPT) in relative to other severe plastic deformations is attributed to the higher strain gradient[32]. The strain gradient of HPT can be roughly estimated by: x=2πN/t, where N is the revolution and t is the sample thickness. By taking the typical HPT parameters, i.e. N=5 and t=0.5 mm, the strain gradient can be estimated to be x ≈0.06 μm−1. Generally, the high strain gradient requires storage