正在加载图片...
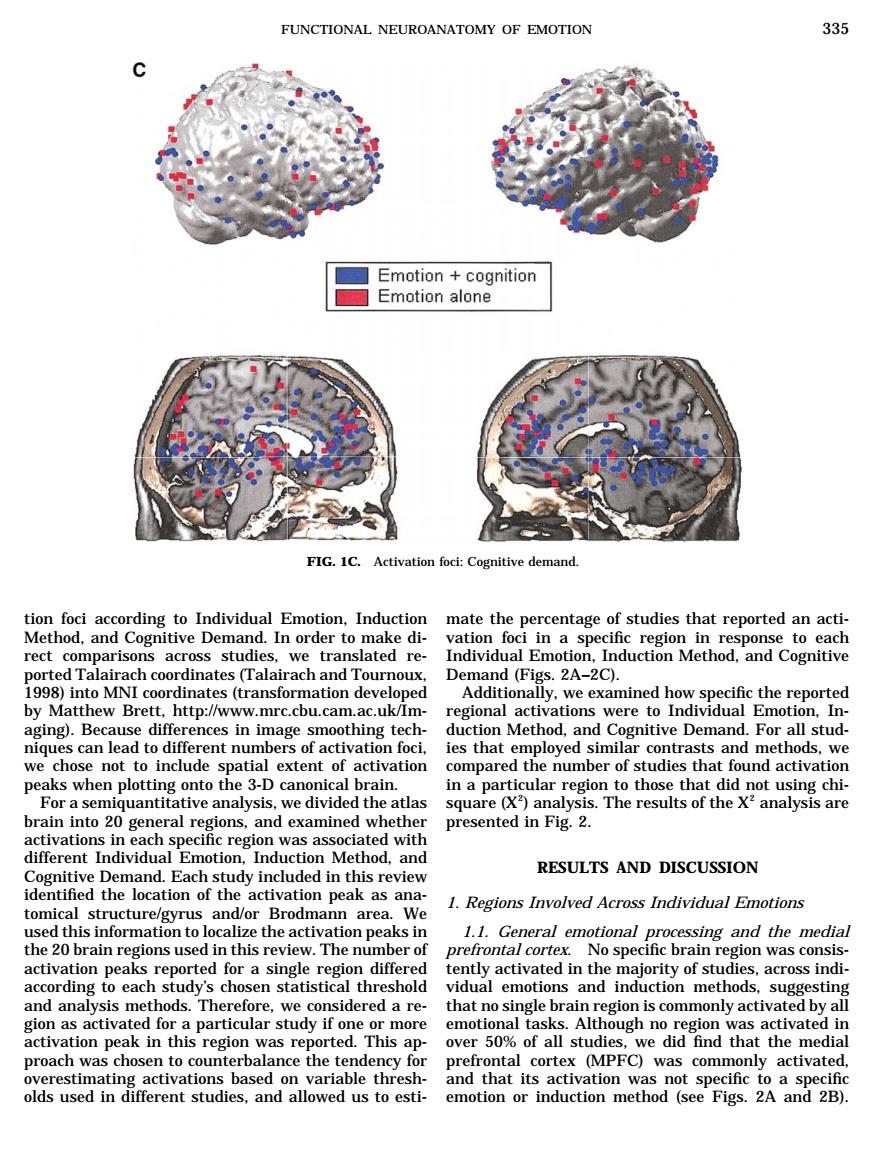
FUNCTIONAL NEUROANATOMY OF EMOTION 36 ☐Emotion+cognition Emotion alone FIG.IC. Activ n foci:Cognitive demand tage of studies that reported an acti- specific tion in se to each rect con parisons across studies.we translated re- Indivumoton.Indun Methd.no (alarachand e nttp: .cam.ac can lead to D os that we chose not to include spatial extent of activation compared the number of studies that found activation peaks when plotting onto the 3-D canonical brain. in a particular region to those that did not using chi- For a semiquantitative analysis,we divided the atl square (X)analysis.The results of the X?analysis are into an presented in Fig.2. egowaoas0atedy udy included in this review RESULTS AND DISCUSSION tomical structure/gyrus and/or Brodmann area. We 1.Regions Involved Across Individual Emotions on to l lize the activation pea s in rCereral emgtionali and the medial 0 tudy's cho hr shold d sidered a re that no single brain egion is commonly activated bya more over 50%of all stuc media proach was choser to counterba ency fo cortex (MPFC)was commonly activated natiionmnetiod2tepig 2A and 2B)tion foci according to Individual Emotion, Induction Method, and Cognitive Demand. In order to make direct comparisons across studies, we translated reported Talairach coordinates (Talairach and Tournoux, 1998) into MNI coordinates (transformation developed by Matthew Brett, http://www.mrc.cbu.cam.ac.uk/Imaging). Because differences in image smoothing techniques can lead to different numbers of activation foci, we chose not to include spatial extent of activation peaks when plotting onto the 3-D canonical brain. For a semiquantitative analysis, we divided the atlas brain into 20 general regions, and examined whether activations in each specific region was associated with different Individual Emotion, Induction Method, and Cognitive Demand. Each study included in this review identified the location of the activation peak as anatomical structure/gyrus and/or Brodmann area. We used this information to localize the activation peaks in the 20 brain regions used in this review. The number of activation peaks reported for a single region differed according to each study’s chosen statistical threshold and analysis methods. Therefore, we considered a region as activated for a particular study if one or more activation peak in this region was reported. This approach was chosen to counterbalance the tendency for overestimating activations based on variable thresholds used in different studies, and allowed us to estimate the percentage of studies that reported an activation foci in a specific region in response to each Individual Emotion, Induction Method, and Cognitive Demand (Figs. 2A–2C). Additionally, we examined how specific the reported regional activations were to Individual Emotion, Induction Method, and Cognitive Demand. For all studies that employed similar contrasts and methods, we compared the number of studies that found activation in a particular region to those that did not using chisquare (X2 ) analysis. The results of the X2 analysis are presented in Fig. 2. RESULTS AND DISCUSSION 1. Regions Involved Across Individual Emotions 1.1. General emotional processing and the medial prefrontal cortex. No specific brain region was consistently activated in the majority of studies, across individual emotions and induction methods, suggesting that no single brain region is commonly activated by all emotional tasks. Although no region was activated in over 50% of all studies, we did find that the medial prefrontal cortex (MPFC) was commonly activated, and that its activation was not specific to a specific emotion or induction method (see Figs. 2A and 2B). FIG. 1C. Activation foci: Cognitive demand. FUNCTIONAL NEUROANATOMY OF EMOTION 335