正在加载图片...

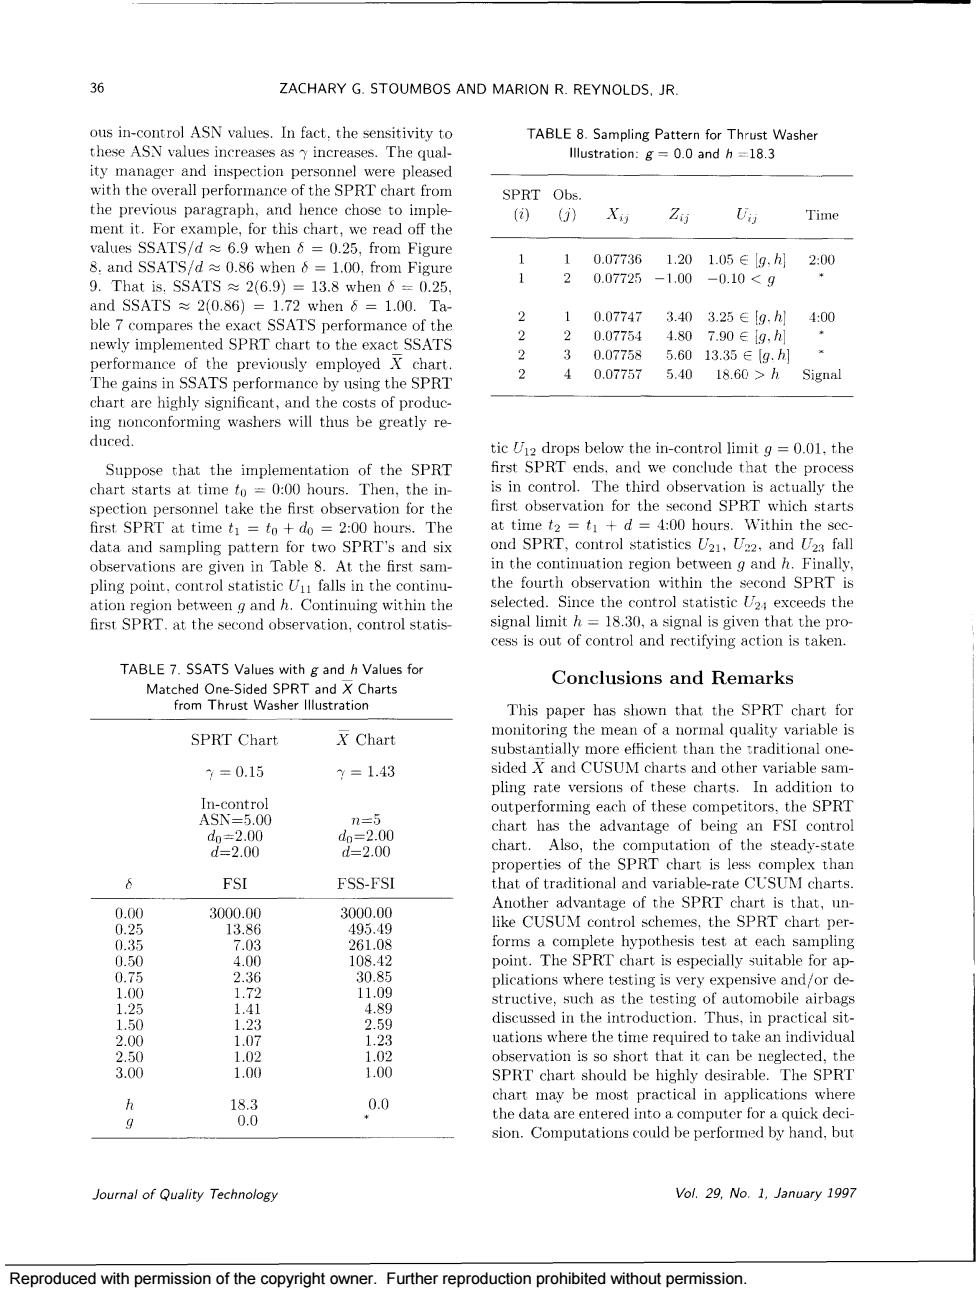
36 ZACHARY G.STOUMBOS AND MARION R.REYNOLDS.JR. ne wer ustration:g=0.0 and h SPRT Ob hence chos 》X Z Time values SSATS/d 6.9 when 6 =0.25.from Figure 1.00. 10.07736 1.201.05∈19.h月2:00 20.07725 -1.00 -0.10<g ble 7 compares the exact SSATS performance of the 2 0.07747 3.403.25∈0.h 400 e ly impleme nted SPRT chart 222 0.07754 0.0r Signal chart are highly significant,and the costs of produc notormingwashcs will thus be greatly re Suppose that the implementation of the SPRT end conclde that the proc chart starts at tin 0:00 hours Then,the h +2200h0 fot The :00 hours.Within thesc data and sampling pattern for two SPRIs and six U21,22 ons are and a fh first een g and h.Continuing within the elected.Since the control statistic 02:exceeds the first SPRT.at the second observation,control statis TABLE 7.SSATS Values with g and h Values for Conclusions and Remarks SPRT Chart noTheinerhas X Chart substantially more efficient than the traditional one ¥=0.15 y=1.43 sided X and CUSUM charts and othe ariable sam the SPRT chart has the advantage of being an FSI contro is the steady-state FSI FSS-FSI 0.00 3000.0W 3000.00 108 poimt.The SPRT chart is i,4 11.0 introduetion.Thus.in practica si 公 25 uations where the time required to take an individua 100 00 188 ,0.0 hart may be most practical in applications wher 0n. Joural of Quality Technology Vol.29.No.1.January 1997 Reproduced with permission of the copyright owner.Further reproduction prohibited without permission Reproduced with permission of the copyright owner. Further reproduction prohibited without permission