正在加载图片...
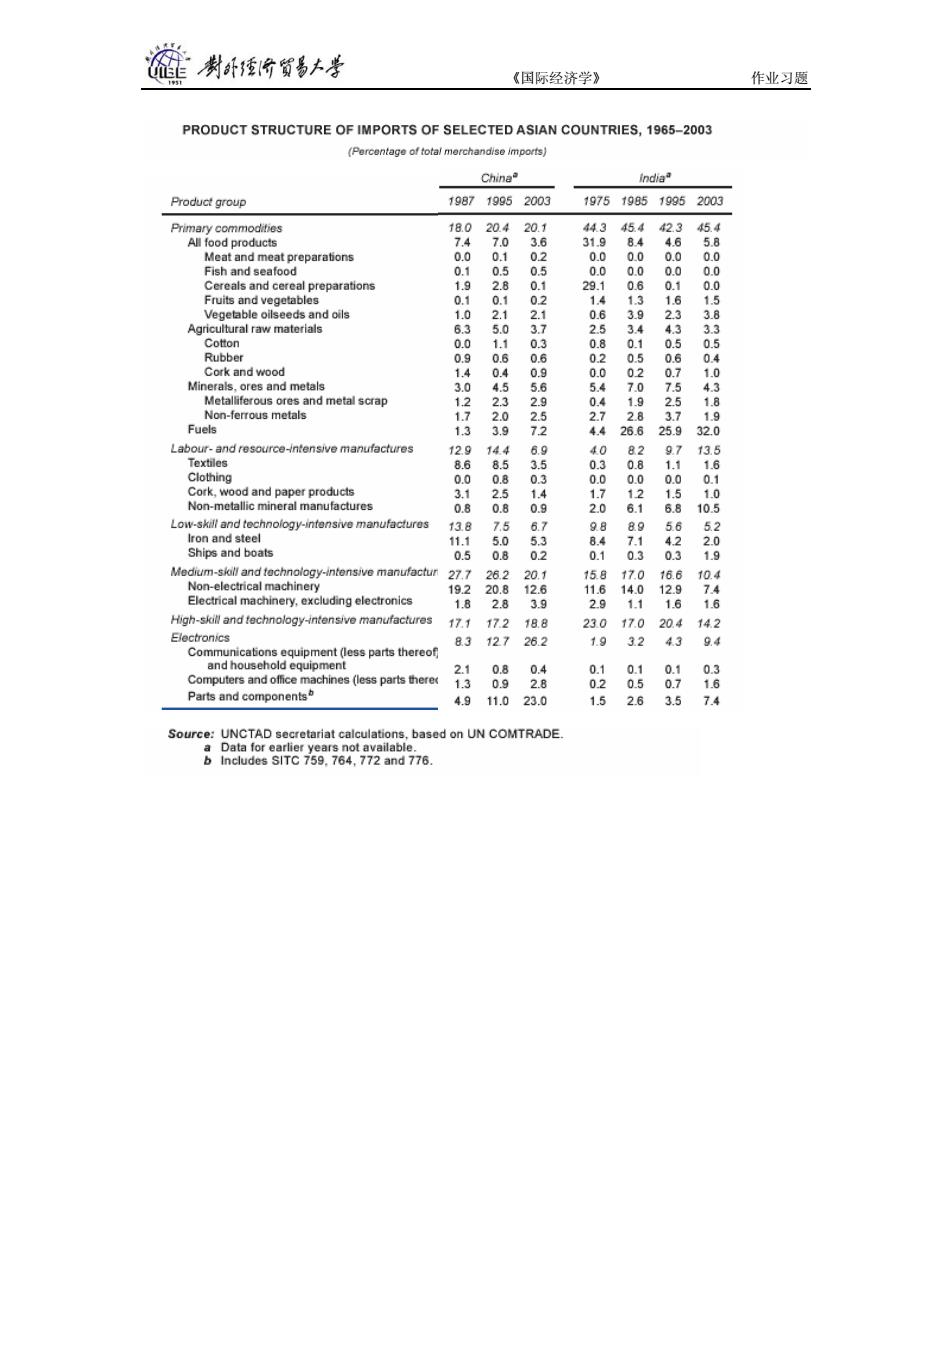
制卧价贸易+考 《国际经济学》 作业习题 PRODUCT STRUCTURE OF IMPORTS OF SELECTED ASIAN COUNTRIES,1965-2003 (Percentage of total merchandise imports) China India Product group 198719952003 1975198519952003 Primary commodities 18.0 20.4 20.1 443 454 23 454 All food products 7.4 7.0 3.6 319 8.4 4.6 5.8 Meat and meat preparations 0.0 0.1 0.2 0.0 0.0 0.0 0.0 Fish and seafood 0.1 0.5 0.5 0.0 0.0 0.0 0.0 Cereals and cereal preparations 1.9 2.8 0.1 29 0.6 0.0 Fruits and vegetables 0.1 0.1 02 14 13 1 1.5 Vegetable oilseeds and oils 1.0 2.1 2.1 0. 3.9 3.8 Agricultural raw materials 6.3 5.0 3.7 2.5 3.4 4.3 3.3 Cotton 0.0 1.1 0.3 0.8 0.1 0 0.5 Rubber 0.9 0.6 0.6 0.2 0.5 0.6 0.4 Cork and wood 1.4 8 02 % 1.0 Minerals,ores and metals 3.0 70 43 Metalliferous ores and metal scrap 1.2 2.3 2.9 1.9 Non-ferrous metals 1.7 2.0 2.5 % 2.8 1.9 Fuels 1.3 3.9 72 4.4 26.6 25.9 32.0 Labour-and resource-ntensive manufactures 129 14.4 40 82 97 13.5 Textiles 8.6 8.5 3.5 0 0.8 1.6 Clothing Cork,wood and paper products 9 8 9 0.0 12 9 Non-metallic mineral manufactures 0.8 0.8 0.9 2.0 6.1 10.5 Low-skill and technology-intensive manufactures 13.8 7.5 67 9 89 56 52 Iron and steel 11.1 5.0 Ships and boats 0.5 0.8 81 7.1 2.0 19 Medium-skill and technology-intensive manufactun 27.7 26.2 , 158 10 10.4 Non-electrical machinery 192 20.8 12.6 14. 12.9 7.4 Electrical machinery,excluding electronics 1.8 2.8 3.9 2.9 1.1 1.6 1.6 High-skill and technology-intensive manufactures 17.1 172 18.8 230 17.0 204 142 Electronics 83 127 26.2 1.9 32 43 Communications equipment(less parts thereof and household equipment 2.1 0.8 Computers and office machines (less parts thered 1.3 0.9 86 82 85 87 8 Parts and components 4.9 11.0 23.0 1 2 3. 74 Source:UNCTAD secretariat calculations,based on UN COMTRADE. a Data for earlier years not available. b Includes SITC 759.764,772 and 776《国际经济学》 作业习题