正在加载图片...
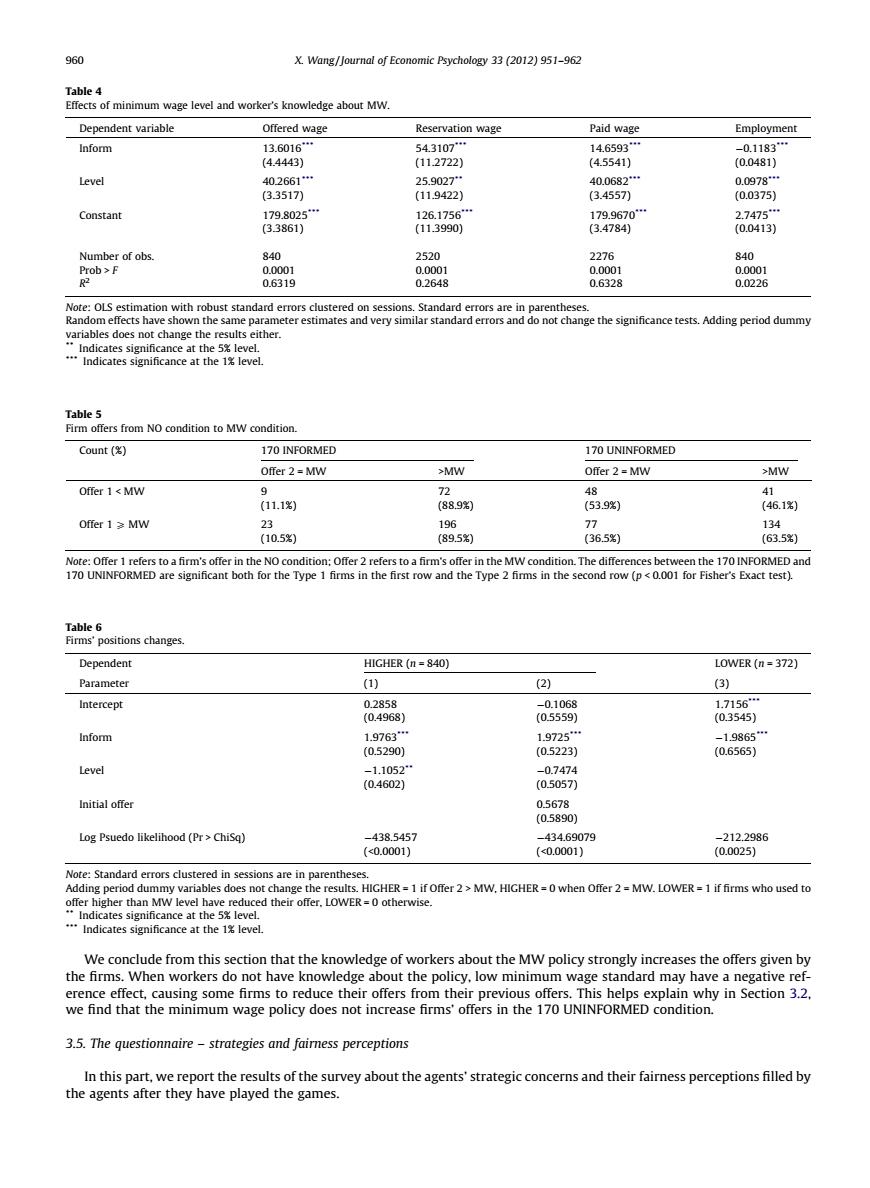
960 X.Wang/Journal of Economic Psychology 33(2012)951-962 evel and worker's knowledge about MW. dent variab ation wag Paid wag 012722 45541) 00481j Level 3517 19422 B457 235 Constant 5 7126056 (3475 Note: OLS estimation with robust standard erre s clust ange ther ndicates MW MW offer 1<MW (1.1图 6.1图 Offer 1>MW h0.5 89.5 365 35 HICHER (n-840 OWER (n-372) Intercept 355 Inform 160 0222) Level itial ofer 05890 Log Psuedo likelihood (Pr>ChiSq) d89 Indicates at the level We conclude from this section that the knowledge of workers about the MW policy strongly increases the offers given by wefind that the minimum wage policy does not in the 170 UNINFORMED condition 3.5.The and fimess perceptions We conclude from this section that the knowledge of workers about the MW policy strongly increases the offers given by the firms. When workers do not have knowledge about the policy, low minimum wage standard may have a negative reference effect, causing some firms to reduce their offers from their previous offers. This helps explain why in Section 3.2, we find that the minimum wage policy does not increase firms’ offers in the 170 UNINFORMED condition. 3.5. The questionnaire – strategies and fairness perceptions In this part, we report the results of the survey about the agents’ strategic concerns and their fairness perceptions filled by the agents after they have played the games. Table 4 Effects of minimum wage level and worker’s knowledge about MW. Dependent variable Offered wage Reservation wage Paid wage Employment Inform 13.6016*** 54.3107*** 14.6593*** 0.1183*** (4.4443) (11.2722) (4.5541) (0.0481) Level 40.2661*** 25.9027** 40.0682*** 0.0978*** (3.3517) (11.9422) (3.4557) (0.0375) Constant 179.8025*** 126.1756*** 179.9670*** 2.7475*** (3.3861) (11.3990) (3.4784) (0.0413) Number of obs. 840 2520 2276 840 Prob > F 0.0001 0.0001 0.0001 0.0001 R2 0.6319 0.2648 0.6328 0.0226 Note: OLS estimation with robust standard errors clustered on sessions. Standard errors are in parentheses. Random effects have shown the same parameter estimates and very similar standard errors and do not change the significance tests. Adding period dummy variables does not change the results either. ** Indicates significance at the 5% level. *** Indicates significance at the 1% level. Table 5 Firm offers from NO condition to MW condition. Count (%) 170 INFORMED 170 UNINFORMED Offer 2 = MW >MW Offer 2 = MW >MW Offer 1 < MW 9 72 48 41 (11.1%) (88.9%) (53.9%) (46.1%) Offer 1 P MW 23 196 77 134 (10.5%) (89.5%) (36.5%) (63.5%) Note: Offer 1 refers to a firm’s offer in the NO condition; Offer 2 refers to a firm’s offer in the MW condition. The differences between the 170 INFORMED and 170 UNINFORMED are significant both for the Type 1 firms in the first row and the Type 2 firms in the second row (p < 0.001 for Fisher’s Exact test). Table 6 Firms’ positions changes. Dependent HIGHER (n = 840) LOWER (n = 372) Parameter (1) (2) (3) Intercept 0.2858 0.1068 1.7156*** (0.4968) (0.5559) (0.3545) Inform 1.9763*** 1.9725*** 1.9865*** (0.5290) (0.5223) (0.6565) Level 1.1052** 0.7474 (0.4602) (0.5057) Initial offer 0.5678 (0.5890) Log Psuedo likelihood (Pr > ChiSq) 438.5457 434.69079 212.2986 (<0.0001) (<0.0001) (0.0025) Note: Standard errors clustered in sessions are in parentheses. Adding period dummy variables does not change the results. HIGHER = 1 if Offer 2 > MW, HIGHER = 0 when Offer 2 = MW. LOWER = 1 if firms who used to offer higher than MW level have reduced their offer, LOWER = 0 otherwise. ** Indicates significance at the 5% level. *** Indicates significance at the 1% level. 960 X. Wang / Journal of Economic Psychology 33 (2012) 951–962��������