正在加载图片...
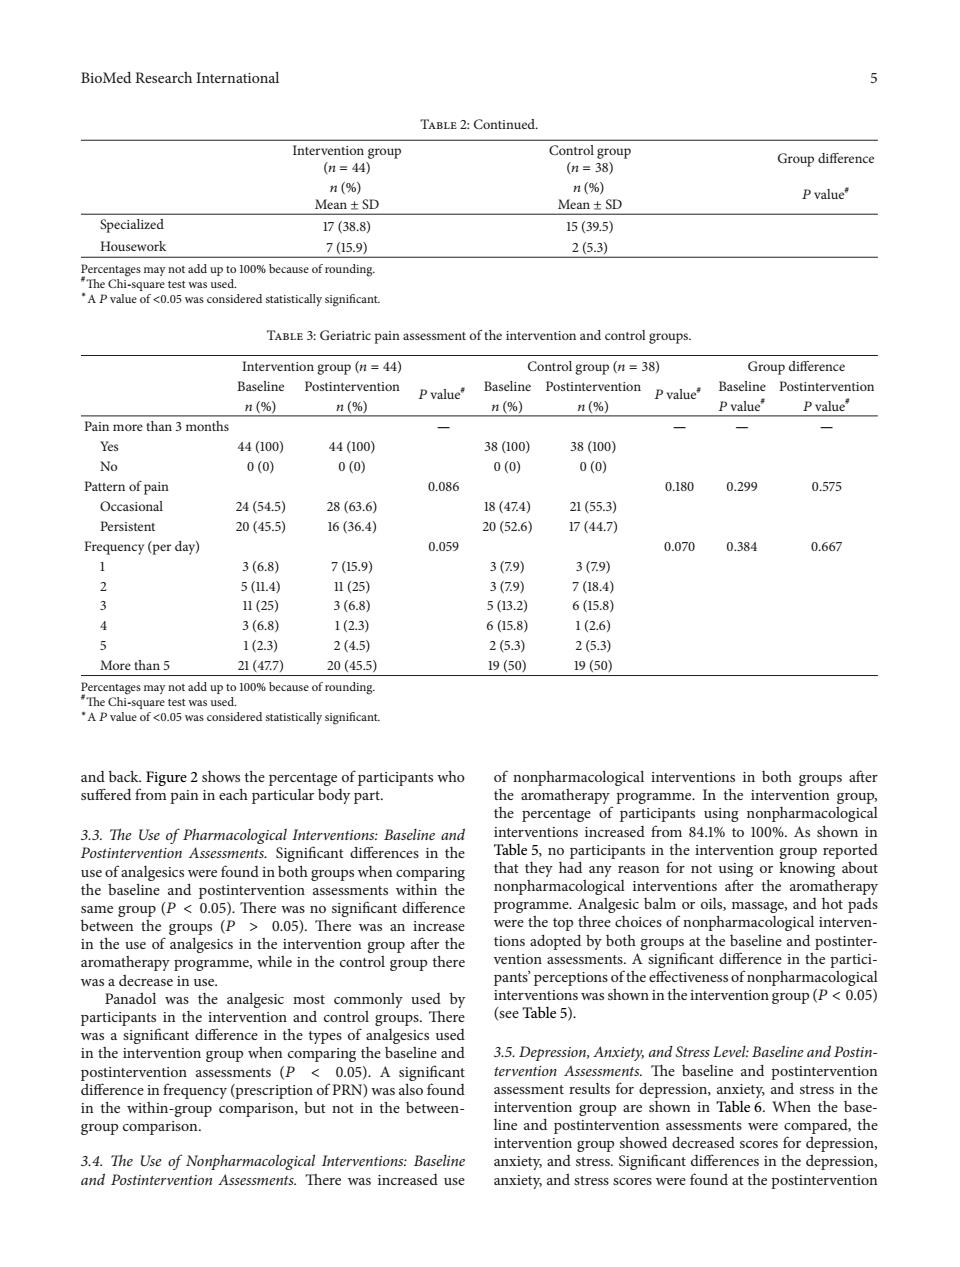
BioMed Research International 5 TABLE 2:Continued. Intervention group Control group Group difference (n=44) (n=38) n(%) n(%) P value Mean±SD Mean±SD Specialized 17(38.8) 15(39.5) Housework 7(15.9) 2(5.3) Percentages may not add up to 100%because of rounding. "The Chi-square test was used. *A P value of <0.05 was considered statistically significant. TABLE 3:Geriatric pain assessment of the intervention and control groups. Intervention group (n=44) Control group (n 38) Group difference Baseline Postintervention P value* Baseline Postintervention Pvalue Baseline Postintervention n(%) n(%) 1(%) n(%) P value" P value Pain more than 3 months Yes 44(100) 44(100) 38(100) 38(100) No 0(0) 0(0) 0(0) 0(0) Pattern of pain 0.086 0.180 0.299 0.575 Occasional 24(54.5) 28(63.6) 18(47.4) 21(55.3) Persistent 20(45.5) 16(36.4) 20(52.6) 17(44.7) Frequency(per day) 0.059 0.070 0.384 0.667 1 3(6.8) 7(15.9) 3(7.9) 3(79) 2 5(11.4) 11(25) 3(7.9) 7(18.4) 3 11(25) 3(6.8) 5(13.2) 6(15.8) 4 3(6.8) 1(2.3) 6(15.8) 1(2.6) 1(2.3) 2(4.5) 2(5.3) 2(5.3) More than 5 21(47.7) 20(45.5) 19(50) 19(50) Percentages may not add up to 100%because of rounding. The Chi-square test was used. "A P value of <0.05 was considered statistically significant. and back.Figure 2 shows the percentage of participants who of nonpharmacological interventions in both groups after suffered from pain in each particular body part. the aromatherapy programme.In the intervention group, the percentage of participants using nonpharmacological 3.3.The Use of Pharmacological Interventions:Baseline and interventions increased from 84.1%to 100%.As shown in Postintervention Assessments.Significant differences in the Table 5,no participants in the intervention group reported use of analgesics were found in both groups when comparing that they had any reason for not using or knowing about the baseline and postintervention assessments within the nonpharmacological interventions after the aromatherapy same group (P 0.05).There was no significant difference programme.Analgesic balm or oils,massage,and hot pads between the groups (P 0.05).There was an increase were the top three choices of nonpharmacological interven- in the use of analgesics in the intervention group after the tions adopted by both groups at the baseline and postinter- aromatherapy programme,while in the control group there vention assessments.A significant difference in the partici- was a decrease in use. pants'perceptions of the effectiveness of nonpharmacological Panadol was the analgesic most commonly used by interventions was shown in the intervention group(P<0.05) participants in the intervention and control groups.There (see Table 5). was a significant difference in the types of analgesics used in the intervention group when comparing the baseline and 3.5.Depression,Anxiety,and Stress Level:Baseline and Postin- postintervention assessments (P 0.05).A significant tervention Assessments.The baseline and postintervention difference in frequency(prescription of PRN)was also found assessment results for depression,anxiety,and stress in the in the within-group comparison,but not in the between- intervention group are shown in Table 6.When the base- group comparison. line and postintervention assessments were compared,the intervention group showed decreased scores for depression, 3.4.The Use of Nonpharmacological Interventions:Baseline anxiety,and stress.Significant differences in the depression, and Postintervention Assessments.There was increased use anxiety,and stress scores were found at the postinterventionBioMed Research International 5 Table 2: Continued. Intervention group (𝑛 = 44) Control group (𝑛 = 38) Group difference 𝑛 (%) Mean ± SD 𝑛 (%) Mean ± SD 𝑃 value# Specialized 17 (38.8) 15 (39.5) Housework 7 (15.9) 2 (5.3) Percentages may not add up to 100% because of rounding. # The Chi-square test was used. ∗A 𝑃 value of <0.05 was considered statistically significant. Table 3: Geriatric pain assessment of the intervention and control groups. Intervention group (𝑛 = 44) Control group (𝑛 = 38) Group difference Baseline Postintervention 𝑃 value# Baseline Postintervention 𝑃 value# Baseline Postintervention 𝑛 (%) 𝑛 (%) 𝑛 (%) 𝑛 (%) 𝑃 value# 𝑃 value# Pain more than 3 months — — — — Yes 44 (100) 44 (100) 38 (100) 38 (100) No 0 (0) 0 (0) 0 (0) 0 (0) Pattern of pain 0.086 0.180 0.299 0.575 Occasional 24 (54.5) 28 (63.6) 18 (47.4) 21 (55.3) Persistent 20 (45.5) 16 (36.4) 20 (52.6) 17 (44.7) Frequency (per day) 0.059 0.070 0.384 0.667 1 3 (6.8) 7 (15.9) 3 (7.9) 3 (7.9) 2 5 (11.4) 11 (25) 3 (7.9) 7 (18.4) 3 11 (25) 3 (6.8) 5 (13.2) 6 (15.8) 4 3 (6.8) 1 (2.3) 6 (15.8) 1 (2.6) 5 1 (2.3) 2 (4.5) 2 (5.3) 2 (5.3) More than 5 21 (47.7) 20 (45.5) 19 (50) 19 (50) Percentages may not add up to 100% because of rounding. # The Chi-square test was used. ∗A 𝑃 value of <0.05 was considered statistically significant. and back. Figure 2 shows the percentage of participants who suffered from pain in each particular body part. 3.3. The Use of Pharmacological Interventions: Baseline and Postintervention Assessments. Significant differences in the use of analgesics were found in both groups when comparing the baseline and postintervention assessments within the same group (𝑃 < 0.05). There was no significant difference between the groups (𝑃 > 0.05). There was an increase in the use of analgesics in the intervention group after the aromatherapy programme, while in the control group there was a decrease in use. Panadol was the analgesic most commonly used by participants in the intervention and control groups. There was a significant difference in the types of analgesics used in the intervention group when comparing the baseline and postintervention assessments (𝑃 < 0.05). A significant difference in frequency (prescription of PRN) was also found in the within-group comparison, but not in the betweengroup comparison. 3.4. The Use of Nonpharmacological Interventions: Baseline and Postintervention Assessments. There was increased use of nonpharmacological interventions in both groups after the aromatherapy programme. In the intervention group, the percentage of participants using nonpharmacological interventions increased from 84.1% to 100%. As shown in Table 5, no participants in the intervention group reported that they had any reason for not using or knowing about nonpharmacological interventions after the aromatherapy programme. Analgesic balm or oils, massage, and hot pads were the top three choices of nonpharmacological interventions adopted by both groups at the baseline and postintervention assessments. A significant difference in the participants’ perceptions of the effectiveness of nonpharmacological interventions was shown in the intervention group (𝑃 < 0.05) (see Table 5). 3.5. Depression, Anxiety, and Stress Level: Baseline and Postintervention Assessments. The baseline and postintervention assessment results for depression, anxiety, and stress in the intervention group are shown in Table 6. When the baseline and postintervention assessments were compared, the intervention group showed decreased scores for depression, anxiety, and stress. Significant differences in the depression, anxiety, and stress scores were found at the postintervention