正在加载图片...
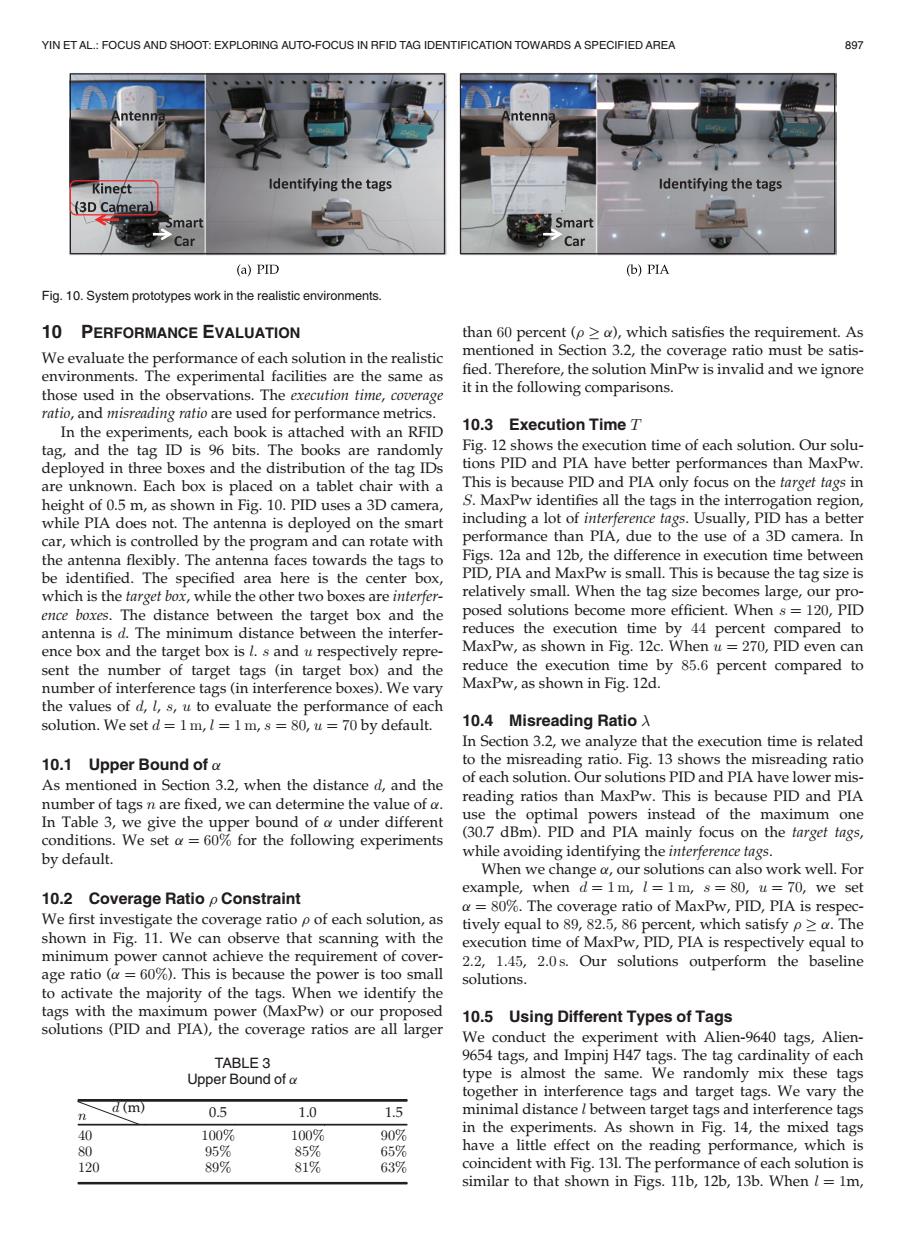
YIN ETAL:FOCUS AND SHOOT:EXPLORING AUTO-FOCUS IN RFID TAG IDENTIFICATION TOWARDS A SPECIFIED AREA 897 nten Kinect Identifying the tags Identifying the tags (3D Cameral Smart Car Car (a)PID (b)PIA Fig.10.System prototypes work in the realistic environments. 10 PERFORMANCE EVALUATION than 60 percent (p >a),which satisfies the requirement.As We evaluate the performance of each solution in the realistic mentioned in Section 3.2,the coverage ratio must be satis- environments.The experimental facilities are the same as fied.Therefore,the solution MinPw is invalid and we ignore those used in the observations.The execution time,coverage it in the following comparisons. ratio,and misreading ratio are used for performance metrics. In the experiments,each book is attached with an RFID 10.3 Execution Time T tag,and the tag ID is 96 bits.The books are randomly Fig.12 shows the execution time of each solution.Our solu- deployed in three boxes and the distribution of the tag IDs tions PID and PIA have better performances than MaxPw. are unknown.Each box is placed on a tablet chair with a This is because PID and PIA only focus on the target tags in height of 0.5 m,as shown in Fig.10.PID uses a 3D camera, S.MaxPw identifies all the tags in the interrogation region, while PIA does not.The antenna is deployed on the smart including a lot of interference tags.Usually,PID has a better car,which is controlled by the program and can rotate with performance than PIA,due to the use of a 3D camera.In the antenna flexibly.The antenna faces towards the tags to Figs.12a and 12b,the difference in execution time between be identified.The specified area here is the center box, PID,PIA and MaxPw is small.This is because the tag size is which is the target box,while the other two boxes are interfer- relatively small.When the tag size becomes large,our pro- ence boxes.The distance between the target box and the posed solutions become more efficient.When s=120,PID antenna is d.The minimum distance between the interfer- reduces the execution time by 44 percent compared to ence box and the target box is l.s and u respectively repre- MaxPw,as shown in Fig.12c.When u 270,PID even can sent the number of target tags (in target box)and the reduce the execution time by 85.6 percent compared to number of interference tags(in interference boxes).We vary MaxPw,as shown in Fig.12d. the values of d,l,s,u to evaluate the performance of each solution.We set d 1m,I=1 m,s =80,u=70 by default. 10.4 Misreading Ratio In Section 3.2,we analyze that the execution time is related 10.1 Upper Bound of a to the misreading ratio.Fig.13 shows the misreading ratio As mentioned in Section 3.2,when the distance d,and the of each solution.Our solutions PID and PIA have lower mis- number of tags n are fixed,we can determine the value of a. reading ratios than MaxPw.This is because PID and PIA In Table 3,we give the upper bound of a under different use the optimal powers instead of the maximum one conditions.We set a=60%for the following experiments (30.7 dBm).PID and PIA mainly focus on the target tags, by default. while avoiding identifying the interference tags. When we change a,our solutions can also work well.For example,when d=1m,l=1m,s=80,u=70,we set 10.2 Coverage Ratio p Constraint a=80%.The coverage ratio of MaxPw,PID,PIA is respec- We first investigate the coverage ratio p of each solution,as tively equal to 89,82.5,86 percent,which satisfy p>a.The shown in Fig.11.We can observe that scanning with the execution time of MaxPw,PID,PIA is respectively equal to minimum power cannot achieve the requirement of cover- 2.2,1.45,2.0s.Our solutions outperform the baseline age ratio (a =60%).This is because the power is too small solutions. to activate the majority of the tags.When we identify the tags with the maximum power(MaxPw)or our proposed 10.5 Using Different Types of Tags solutions (PID and PIA),the coverage ratios are all larger We conduct the experiment with Alien-9640 tags,Alien- TABLE 3 9654 tags,and Impinj H47 tags.The tag cardinality of each Upper Bound of a type is almost the same.We randomly mix these tags together in interference tags and target tags.We vary the 会 d (m) 0.5 1.0 1.5 minimal distance l between target tags and interference tags 40 100% 100% 90% in the experiments.As shown in Fig.14,the mixed tags 80 95% 85% 65% have a little effect on the reading performance,which is 120 89% 81% 63% coincident with Fig.131.The performance of each solution is similar to that shown in Figs.11b,12b,13b.When l=1m,10 PERFORMANCE EVALUATION We evaluate the performance of each solution in the realistic environments. The experimental facilities are the same as those used in the observations. The execution time, coverage ratio, and misreading ratio are used for performance metrics. In the experiments, each book is attached with an RFID tag, and the tag ID is 96 bits. The books are randomly deployed in three boxes and the distribution of the tag IDs are unknown. Each box is placed on a tablet chair with a height of 0.5 m, as shown in Fig. 10. PID uses a 3D camera, while PIA does not. The antenna is deployed on the smart car, which is controlled by the program and can rotate with the antenna flexibly. The antenna faces towards the tags to be identified. The specified area here is the center box, which is the target box, while the other two boxes are interference boxes. The distance between the target box and the antenna is d. The minimum distance between the interference box and the target box is l. s and u respectively represent the number of target tags (in target box) and the number of interference tags (in interference boxes). We vary the values of d, l, s, u to evaluate the performance of each solution. We set d ¼ 1 m, l ¼ 1 m, s ¼ 80, u ¼ 70 by default. 10.1 Upper Bound of a As mentioned in Section 3.2, when the distance d, and the number of tags n are fixed, we can determine the value of a. In Table 3, we give the upper bound of a under different conditions. We set a ¼ 60% for the following experiments by default. 10.2 Coverage Ratio r Constraint We first investigate the coverage ratio r of each solution, as shown in Fig. 11. We can observe that scanning with the minimum power cannot achieve the requirement of coverage ratio (a ¼ 60%). This is because the power is too small to activate the majority of the tags. When we identify the tags with the maximum power (MaxPw) or our proposed solutions (PID and PIA), the coverage ratios are all larger than 60 percent (r a), which satisfies the requirement. As mentioned in Section 3.2, the coverage ratio must be satis- fied. Therefore, the solution MinPw is invalid and we ignore it in the following comparisons. 10.3 Execution Time T Fig. 12 shows the execution time of each solution. Our solutions PID and PIA have better performances than MaxPw. This is because PID and PIA only focus on the target tags in S. MaxPw identifies all the tags in the interrogation region, including a lot of interference tags. Usually, PID has a better performance than PIA, due to the use of a 3D camera. In Figs. 12a and 12b, the difference in execution time between PID, PIA and MaxPw is small. This is because the tag size is relatively small. When the tag size becomes large, our proposed solutions become more efficient. When s ¼ 120, PID reduces the execution time by 44 percent compared to MaxPw, as shown in Fig. 12c. When u ¼ 270, PID even can reduce the execution time by 85:6 percent compared to MaxPw, as shown in Fig. 12d. 10.4 Misreading Ratio In Section 3.2, we analyze that the execution time is related to the misreading ratio. Fig. 13 shows the misreading ratio of each solution. Our solutions PID and PIA have lower misreading ratios than MaxPw. This is because PID and PIA use the optimal powers instead of the maximum one (30.7 dBm). PID and PIA mainly focus on the target tags, while avoiding identifying the interference tags. When we change a, our solutions can also work well. For example, when d ¼ 1 m, l ¼ 1 m, s ¼ 80, u ¼ 70, we set a ¼ 80%. The coverage ratio of MaxPw, PID, PIA is respectively equal to 89, 82:5, 86 percent, which satisfy r a. The execution time of MaxPw, PID, PIA is respectively equal to 2:2, 1:45, 2:0 s. Our solutions outperform the baseline solutions. 10.5 Using Different Types of Tags We conduct the experiment with Alien-9640 tags, Alien- 9654 tags, and Impinj H47 tags. The tag cardinality of each type is almost the same. We randomly mix these tags together in interference tags and target tags. We vary the minimal distance l between target tags and interference tags in the experiments. As shown in Fig. 14, the mixed tags have a little effect on the reading performance, which is coincident with Fig. 13l. The performance of each solution is similar to that shown in Figs. 11b, 12b, 13b. When l ¼ 1m, Fig. 10. System prototypes work in the realistic environments. TABLE 3 Upper Bound of a n d (m) 0.5 1.0 1.5 40 100% 100% 90% 80 95% 85% 65% 120 89% 81% 63% YIN ET AL.: FOCUS AND SHOOT: EXPLORING AUTO-FOCUS IN RFID TAG IDENTIFICATION TOWARDS A SPECIFIED AREA 897�